Electronic Arts 2014 Annual Report Download - page 167
Download and view the complete annual report
Please find page 167 of the 2014 Electronic Arts annual report below. You can navigate through the pages in the report by either clicking on the pages listed below, or by using the keyword search tool below to find specific information within the annual report.-
 1
1 -
2
-
3
-
4
-
5
-
6
-
7
-
8
-
9
-
10
-
11
-
12
-
13
-
14
-
15
-
16
-
17
-
18
-
19
-
20
-
21
-
22
-
23
-
24
-
25
-
26
-
27
-
28
-
29
-
30
-
31
-
32
-
33
-
34
-
35
-
36
-
37
-
38
-
39
-
40
-
41
-
42
-
43
-
44
-
45
-
46
-
47
-
48
-
49
-
50
-
51
-
52
-
53
-
54
-
55
-
56
-
57
-
58
-
59
-
60
-
61
-
62
-
63
-
64
-
65
-
66
-
67
-
68
-
69
-
70
-
71
-
72
-
73
-
74
-
75
-
76
-
77
-
78
-
79
-
80
-
81
-
82
-
83
-
84
-
85
-
86
-
87
-
88
-
89
-
90
-
91
-
92
-
93
-
94
-
95
-
96
-
97
-
98
-
99
-
100
-
101
-
102
-
103
-
104
-
105
-
106
-
107
-
108
-
109
-
110
-
111
-
112
-
113
-
114
-
115
-
116
-
117
-
118
-
119
-
120
-
121
-
122
-
123
-
124
-
125
-
126
-
127
-
128
-
129
-
130
-
131
-
132
-
133
-
134
-
135
-
136
-
137
-
138
-
139
-
140
-
141
-
142
-
143
-
144
-
145
-
146
-
147
-
148
-
149
-
150
-
151
-
152
-
153
-
154
-
155
-
156
-
 157
157 -
 158
158 -
 159
159 -
 160
160 -
 161
161 -
 162
162 -
 163
163 -
 164
164 -
 165
165 -
 166
166 -
 167
167 -
 168
168 -
 169
169 -
 170
170 -
 171
171 -
 172
172 -
 173
173 -
 174
174 -
 175
175 -
 176
176 -
 177
177 -
178
-
179
-
180
-
181
-
182
-
183
-
184
-
185
-
186
-
187
-
188
 |
 |

Annual Report
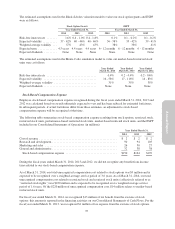
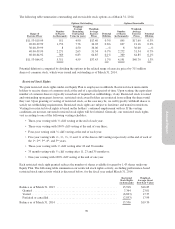
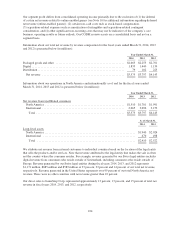
The estimated assumptions used in the Black-Scholes valuation model to value our stock option grants and ESPP
were as follows:
Stock Option Grants ESPP
Year Ended March 31, Year Ended March 31,
2014 2013 2012 2014 2013 2012
Risk-free interest rate ....... 1.6% 0.4 - 1.0% 0.4 - 1.8% 0.1% 0.1 - 0.2% 0.1 - 0.2%
Expected volatility .......... 37-42% 40-46% 40-46% 36-38% 35-42% 39-41%
Weighted-average volatility . . . 37% 43% 43% 38% 38% 41%
Expected term ............. 4.5years 4.4 years 4.4 years 6 - 12 months 6 - 12 months 6 - 12 months
Expected dividends ......... None None None None None None
The estimated assumptions used in the Monte-Carlo simulation model to value our market-based restricted stock
units were as follows:
Year Ended
March 31, 2014
Year Ended
March 31, 2013
Year Ended
March 31, 2012
Risk-free interest rate .................................. 0.4% 0.2 - 0.4% 0.2 - 0.6%
Expected volatility .................................... 16-58% 17-116% 14 - 83%
Weighted-average volatility ............................. 31% 35% 35%
Expected dividends .................................... None None None
Stock-Based Compensation Expense
Employee stock-based compensation expense recognized during the fiscal years ended March 31, 2014, 2013 and
2012 was calculated based on awards ultimately expected to vest and has been reduced for estimated forfeitures.
In subsequent periods, if actual forfeitures differ from those estimates, an adjustment to stock-based
compensation expense will be recognized at that time.
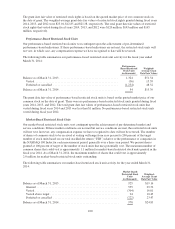
The following table summarizes stock-based compensation expense resulting from stock options, restricted stock,
restricted stock units, performance-based restricted stock units, market-based restricted stock units, and the ESPP
included in our Consolidated Statements of Operations (in millions):
Year Ended March 31,
2014 2013 2012
Cost of revenue ..................................................... $ 2 $ 2 $ 2
Research and development ............................................ 90 94 103
Marketing and sales ................................................. 26 30 27
General and administrative ............................................ 32 38 38
Stock-based compensation expense ................................... $150 $164 $170
During the fiscal years ended March 31, 2014, 2013 and 2012, we did not recognize any benefit from income
taxes related to our stock-based compensation expense.
As of March 31, 2014, our total unrecognized compensation cost related to stock options was $9 million and is
expected to be recognized over a weighted-average service period of 3.6 years. As of March 31, 2014, our total
unrecognized compensation cost related to restricted stock and restricted stock units (collectively referred to as
“restricted stock rights”) was $220 million and is expected to be recognized over a weighted-average service
period of 1.6 years. Of the $220 million of unrecognized compensation cost, $14 million relates to market-based
restricted stock units.
For fiscal year ended March 31, 2014, we recognized $13 million of tax benefit from the exercise of stock
options; this amount is reported in the financing activities on our Consolidated Statements of Cash Flows. For the
fiscal year ended March 31, 2013, we recognized $1 million of tax expense from the exercise of stock options,
97