Electronic Arts 2014 Annual Report Download - page 109
Download and view the complete annual report
Please find page 109 of the 2014 Electronic Arts annual report below. You can navigate through the pages in the report by either clicking on the pages listed below, or by using the keyword search tool below to find specific information within the annual report.-
 1
1 -
2
-
3
-
4
-
5
-
6
-
7
-
8
-
9
-
10
-
11
-
12
-
13
-
14
-
15
-
16
-
17
-
18
-
19
-
20
-
21
-
22
-
23
-
24
-
25
-
26
-
27
-
28
-
29
-
30
-
31
-
32
-
33
-
34
-
35
-
36
-
37
-
38
-
39
-
40
-
41
-
42
-
43
-
44
-
45
-
46
-
47
-
48
-
49
-
50
-
51
-
52
-
53
-
54
-
55
-
56
-
57
-
58
-
59
-
60
-
61
-
62
-
63
-
64
-
65
-
66
-
67
-
68
-
69
-
70
-
71
-
72
-
73
-
74
-
75
-
76
-
77
-
78
-
79
-
80
-
81
-
82
-
83
-
84
-
85
-
86
-
87
-
88
-
89
-
90
-
91
-
92
-
93
-
94
-
95
-
96
-
97
-
98
-
 99
99 -
 100
100 -
 101
101 -
 102
102 -
 103
103 -
 104
104 -
 105
105 -
 106
106 -
 107
107 -
 108
108 -
 109
109 -
 110
110 -
 111
111 -
 112
112 -
 113
113 -
 114
114 -
 115
115 -
 116
116 -
 117
117 -
 118
118 -
 119
119 -
120
-
121
-
122
-
123
-
124
-
125
-
126
-
127
-
128
-
129
-
130
-
131
-
132
-
133
-
134
-
135
-
136
-
137
-
138
-
139
-
140
-
141
-
142
-
143
-
144
-
145
-
146
-
147
-
148
-
149
-
150
-
151
-
152
-
153
-
154
-
155
-
156
-
157
-
158
-
159
-
160
-
161
-
162
-
163
-
164
-
165
-
166
-
167
-
168
-
169
-
170
-
171
-
172
-
173
-
174
-
175
-
176
-
177
-
178
-
179
-
180
-
181
-
182
-
183
-
184
-
185
-
186
-
187
-
188
 |
 |

Annual Report
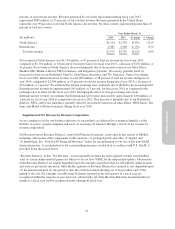
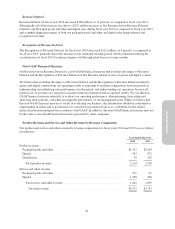
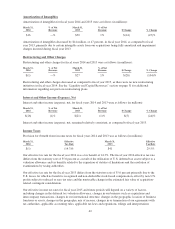
Revenue Deferral
Revenue Deferral for fiscal year 2014 increased $328 million, or 11 percent, as compared to fiscal year 2013.
Substantially all of this increase was due to a $251 million increase in Net Revenue before Revenue Deferral
related to our Packaged goods and other and digital sales during fiscal year 2014 as compared to fiscal year 2013,
and a slightly higher percentage of both our packaged goods and other and digital sales being deferred and
recognized over time.
Recognition of Revenue Deferral
The Recognition of Revenue Deferral for fiscal year 2014 decreased $122 million, or 4 percent, as compared to
fiscal year 2013, primarily due to the increase in our estimated offering period, which commenced during the
second quarter of fiscal 2014 for physical games sold through retail from six to nine months.
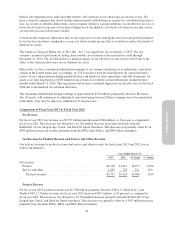
Non-GAAP Financial Measures
Net Revenue before Revenue Deferral is a non-GAAP financial measure that excludes the impact of Revenue
Deferral and the Recognition of Revenue Deferral on Net Revenue related to sales of games and digital content.
We believe that excluding the impact of Revenue Deferral and the Recognition of Revenue Deferral related to
games and digital content from our operating results is important to facilitate comparisons between periods in
understanding our underlying sales performance for the period, and understanding our operations because all
related costs of revenues are expensed as incurred instead of deferred and recognized ratably. We use this non-
GAAP financial measure internally to evaluate our operating performance, when planning, forecasting and
analyzing future periods, and when assessing the performance of our management team. While we believe that
this non-GAAP financial measure is useful in evaluating our business, this information should be considered as
supplemental in nature and is not meant to be considered in isolation from or as a substitute for the related
financial information prepared in accordance with GAAP. In addition, this non-GAAP financial measure may not
be the same as non-GAAP financial measures presented by other companies.
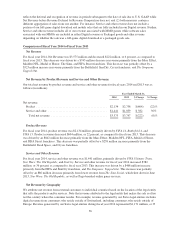
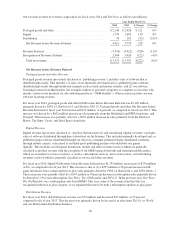
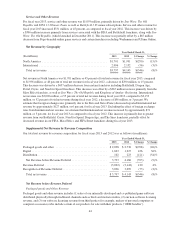
Product Revenue and Service and Other Revenue by Revenue Composition
Our product and service and other revenue by revenue composition for fiscal years 2014 and 2013 was as follows
(in millions):
Year Ended March 31
2014 2013
Product revenue:
Packaged goods and other ............................................... $1,512 $2,164
Digital ............................................................... 543 472
Distribution ........................................................... 79 102
Total product revenue ................................................. 2,134 2,738
Service and other revenue:
Packaged goods and other ............................................... 151 91
Digital ............................................................... 1,290 968
Total service and other revenue ......................................... 1,441 1,059
Total net revenue .................................................. $3,575 $3,797
39