Electronic Arts 2014 Annual Report Download - page 147
Download and view the complete annual report
Please find page 147 of the 2014 Electronic Arts annual report below. You can navigate through the pages in the report by either clicking on the pages listed below, or by using the keyword search tool below to find specific information within the annual report.-
 1
1 -
2
-
3
-
4
-
5
-
6
-
7
-
8
-
9
-
10
-
11
-
12
-
13
-
14
-
15
-
16
-
17
-
18
-
19
-
20
-
21
-
22
-
23
-
24
-
25
-
26
-
27
-
28
-
29
-
30
-
31
-
32
-
33
-
34
-
35
-
36
-
37
-
38
-
39
-
40
-
41
-
42
-
43
-
44
-
45
-
46
-
47
-
48
-
49
-
50
-
51
-
52
-
53
-
54
-
55
-
56
-
57
-
58
-
59
-
60
-
61
-
62
-
63
-
64
-
65
-
66
-
67
-
68
-
69
-
70
-
71
-
72
-
73
-
74
-
75
-
76
-
77
-
78
-
79
-
80
-
81
-
82
-
83
-
84
-
85
-
86
-
87
-
88
-
89
-
90
-
91
-
92
-
93
-
94
-
95
-
96
-
97
-
98
-
99
-
100
-
101
-
102
-
103
-
104
-
105
-
106
-
107
-
108
-
109
-
110
-
111
-
112
-
113
-
114
-
115
-
116
-
117
-
118
-
119
-
120
-
121
-
122
-
123
-
124
-
125
-
126
-
127
-
128
-
129
-
130
-
131
-
132
-
133
-
134
-
135
-
136
-
 137
137 -
 138
138 -
 139
139 -
 140
140 -
 141
141 -
 142
142 -
 143
143 -
 144
144 -
 145
145 -
 146
146 -
 147
147 -
 148
148 -
 149
149 -
 150
150 -
 151
151 -
 152
152 -
 153
153 -
 154
154 -
 155
155 -
 156
156 -
 157
157 -
158
-
159
-
160
-
161
-
162
-
163
-
164
-
165
-
166
-
167
-
168
-
169
-
170
-
171
-
172
-
173
-
174
-
175
-
176
-
177
-
178
-
179
-
180
-
181
-
182
-
183
-
184
-
185
-
186
-
187
-
188
 |
 |

Annual Report
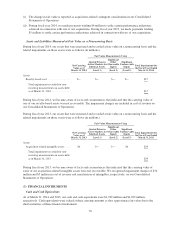
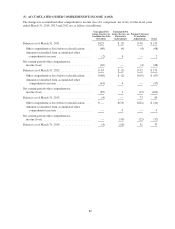
Short-Term Investments
Short-term investments consisted of the following as of March 31, 2014 and 2013 (in millions):
As of March 31, 2014 As of March 31, 2013
Cost or
Amortized
Cost
Gross Unrealized Fair
Value
Cost or
Amortized
Cost
Gross Unrealized Fair
ValueGains Losses Gains Losses
Corporate bonds ................... $279 $— $— $279 $177 $ 1 $— $178
U.S. Treasury securities ............. 114 — — 114 85 — — 85
Commercial paper .................. 110 — — 110 49 — — 49
U.S. agency securities ............... 80 — — 80 76 — — 76
Short-term investments ............ $583 $— $— $583 $387 $ 1 $— $388
We evaluate our investments for impairment quarterly. Factors considered in the review of investments with an
unrealized loss include the credit quality of the issuer, the duration that the fair value has been less than the
adjusted cost basis, severity of the impairment, reason for the decline in value and potential recovery period, the
financial condition and near-term prospects of the investees, our intent to sell and ability to hold the investment
for a period of time sufficient to allow for any anticipated recovery in market value, and any contractual terms
impacting the prepayment or settlement process. Based on our review, we did not consider these investments to
be other-than-temporarily impaired as of March 31, 2014 and 2013.
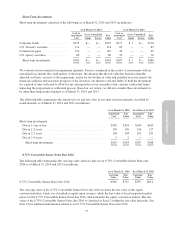
The following table summarizes the amortized cost and fair value of our short-term investments, classified by
stated maturity as of March 31, 2014 and 2013 (in millions):
As of March 31, 2014 As of March 31, 2013
Amortized
Cost
Fair
Value
Amortized
Cost
Fair
Value
Short-term investments
Due in 1 year or less ....................................... $318 $318 $160 $160
Due in 1-2 years .......................................... 156 156 126 127
Due in 2-3 years .......................................... 104 104 101 101
Due in 3-4 years .......................................... 5 5 — —
Short-term investments ................................... $583 $583 $387 $388
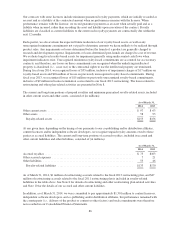
0.75% Convertible Senior Notes Due 2016
The following table summarizes the carrying value and fair value of our 0.75% Convertible Senior Notes due
2016 as of March 31, 2014 and 2013 (in millions):
As of March 31, 2014 As of March 31, 2013
Carrying
Value
Fair
Value
Carrying
Value
Fair
Value
0.75% Convertible Senior Notes due 2016 ........................ $580 $731 $559 $614
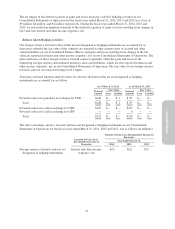
The carrying value of the 0.75% Convertible Senior Notes due 2016 excludes the fair value of the equity
conversion feature, which was classified as equity upon issuance, while the fair value is based on quoted market
prices for the 0.75% Convertible Senior Notes due 2016, which includes the equity conversion feature. The fair
value of the 0.75% Convertible Senior Notes due 2016 is classified as Level 2 within the fair value hierarchy. See
Note 12 for additional information related to our 0.75% Convertible Senior Notes due 2016.
77