Electronic Arts 2014 Annual Report Download - page 153
Download and view the complete annual report
Please find page 153 of the 2014 Electronic Arts annual report below. You can navigate through the pages in the report by either clicking on the pages listed below, or by using the keyword search tool below to find specific information within the annual report.-
 1
1 -
2
-
3
-
4
-
5
-
6
-
7
-
8
-
9
-
10
-
11
-
12
-
13
-
14
-
15
-
16
-
17
-
18
-
19
-
20
-
21
-
22
-
23
-
24
-
25
-
26
-
27
-
28
-
29
-
30
-
31
-
32
-
33
-
34
-
35
-
36
-
37
-
38
-
39
-
40
-
41
-
42
-
43
-
44
-
45
-
46
-
47
-
48
-
49
-
50
-
51
-
52
-
53
-
54
-
55
-
56
-
57
-
58
-
59
-
60
-
61
-
62
-
63
-
64
-
65
-
66
-
67
-
68
-
69
-
70
-
71
-
72
-
73
-
74
-
75
-
76
-
77
-
78
-
79
-
80
-
81
-
82
-
83
-
84
-
85
-
86
-
87
-
88
-
89
-
90
-
91
-
92
-
93
-
94
-
95
-
96
-
97
-
98
-
99
-
100
-
101
-
102
-
103
-
104
-
105
-
106
-
107
-
108
-
109
-
110
-
111
-
112
-
113
-
114
-
115
-
116
-
117
-
118
-
119
-
120
-
121
-
122
-
123
-
124
-
125
-
126
-
127
-
128
-
129
-
130
-
131
-
132
-
133
-
134
-
135
-
136
-
137
-
138
-
139
-
140
-
141
-
142
-
 143
143 -
 144
144 -
 145
145 -
 146
146 -
 147
147 -
 148
148 -
 149
149 -
 150
150 -
 151
151 -
 152
152 -
 153
153 -
 154
154 -
 155
155 -
 156
156 -
 157
157 -
 158
158 -
 159
159 -
 160
160 -
 161
161 -
 162
162 -
 163
163 -
164
-
165
-
166
-
167
-
168
-
169
-
170
-
171
-
172
-
173
-
174
-
175
-
176
-
177
-
178
-
179
-
180
-
181
-
182
-
183
-
184
-
185
-
186
-
187
-
188
 |
 |

Annual Report
The results of operations of PopCap and the estimated fair market values of the assets acquired and liabilities
assumed have been included in our Consolidated Financial Statements since the date of acquisition. Pro forma
results of operations have not been presented because the effect of the acquisition was not material to our
Consolidated Statements of Operations.
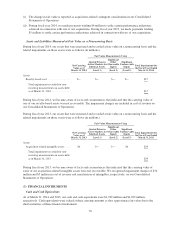
Other Fiscal 2012 Acquisitions
During the fiscal year ended March 31, 2012, we completed four other acquisitions. These business combinations
were completed for total cash consideration of approximately $55 million. These acquisitions were not material
to our Consolidated Balance Sheets and Statements of Operations. The results of operations and the estimated
fair value of the acquired assets and assumed liabilities have been included in our Consolidated Financial
Statements since the date of the acquisitions. See Note 7 for information regarding goodwill and acquisition-
related intangible assets. Pro forma results of operations have not been presented because the effect of the
acquisitions was not material to our Consolidated Statements of Operations.
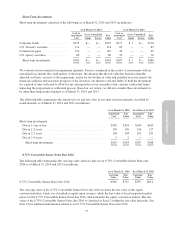
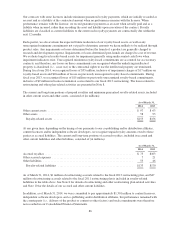
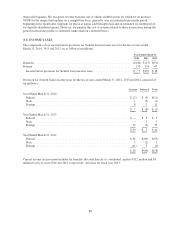
(7) GOODWILL AND ACQUISITION-RELATED INTANGIBLES, NET
The changes in the carrying amount of goodwill for the fiscal year ended March 31, 2014 are as follows (in
millions):
As of
March 31, 2013 Activity
Effects of Foreign
Currency
Translation
As of
March 31, 2014
Goodwill .................................... $2,089 $ 5 $ (3) $2,091
Accumulated impairment ....................... (368) — — (368)
Total ...................................... $1,721 $ 5 $ (3) $1,723
The changes in the carrying amount of goodwill for the fiscal year ended March 31, 2013 are as follows (in
millions):
As of
March 31, 2012 Activity
Effects of Foreign
Currency
Translation
As of
March 31, 2013
Goodwill .................................... $2,086 $ 3 $— $2,089
Accumulated impairment ....................... (368) — — (368)
Total ...................................... $1,718 $ 3 $— $1,721
Goodwill represents the excess of the purchase price over the fair value of the underlying acquired net tangible
and intangible assets. Goodwill is not amortized, but rather subject to at least an annual assessment for
impairment by applying a fair value-based test. Our goodwill is fully attributed to our operating segment. See
Note 18 for additional information regarding our segment information.
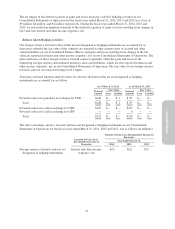
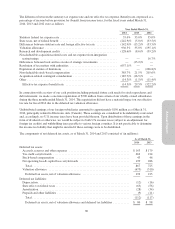
Acquisition-related intangibles, consisted of the following (in millions):
As of March 31, 2014 As of March 31, 2013
Gross
Carrying
Amount
Accumulated
Amortization
Acquisition-
Related
Intangibles, Net
Gross
Carrying
Amount
Accumulated
Amortization
Acquisition-
Related
Intangibles, Net
Developed and core technology ......... $531 $(385) $146 $527 $(324) $203
Trade names and trademarks ........... 130 (105) 25 130 (99) 31
Registered user base and other intangibles . . 87 (87) — 87 (84) 3
Carrier contracts and related ............ 85 (79) 6 85 (73) 12
In-process research and development ..... — — — 4 — 4
Total ............................ $833 $(656) $177 $833 $(580) $253
83