Electronic Arts 2014 Annual Report Download - page 172
Download and view the complete annual report
Please find page 172 of the 2014 Electronic Arts annual report below. You can navigate through the pages in the report by either clicking on the pages listed below, or by using the keyword search tool below to find specific information within the annual report.-
 1
1 -
2
-
3
-
4
-
5
-
6
-
7
-
8
-
9
-
10
-
11
-
12
-
13
-
14
-
15
-
16
-
17
-
18
-
19
-
20
-
21
-
22
-
23
-
24
-
25
-
26
-
27
-
28
-
29
-
30
-
31
-
32
-
33
-
34
-
35
-
36
-
37
-
38
-
39
-
40
-
41
-
42
-
43
-
44
-
45
-
46
-
47
-
48
-
49
-
50
-
51
-
52
-
53
-
54
-
55
-
56
-
57
-
58
-
59
-
60
-
61
-
62
-
63
-
64
-
65
-
66
-
67
-
68
-
69
-
70
-
71
-
72
-
73
-
74
-
75
-
76
-
77
-
78
-
79
-
80
-
81
-
82
-
83
-
84
-
85
-
86
-
87
-
88
-
89
-
90
-
91
-
92
-
93
-
94
-
95
-
96
-
97
-
98
-
99
-
100
-
101
-
102
-
103
-
104
-
105
-
106
-
107
-
108
-
109
-
110
-
111
-
112
-
113
-
114
-
115
-
116
-
117
-
118
-
119
-
120
-
121
-
122
-
123
-
124
-
125
-
126
-
127
-
128
-
129
-
130
-
131
-
132
-
133
-
134
-
135
-
136
-
137
-
138
-
139
-
140
-
141
-
142
-
143
-
144
-
145
-
146
-
147
-
148
-
149
-
150
-
151
-
152
-
153
-
154
-
155
-
156
-
157
-
158
-
159
-
160
-
161
-
 162
162 -
 163
163 -
 164
164 -
 165
165 -
 166
166 -
 167
167 -
 168
168 -
 169
169 -
 170
170 -
 171
171 -
 172
172 -
 173
173 -
 174
174 -
 175
175 -
 176
176 -
 177
177 -
 178
178 -
 179
179 -
 180
180 -
 181
181 -
 182
182 -
183
-
184
-
185
-
186
-
187
-
188
 |
 |

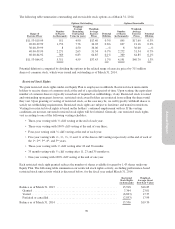
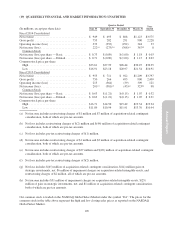
The following table summarizes total shares repurchased and retired during fiscal years 2013 and 2012:
February 2011 Program July 2012 Program Total
(In millions) Shares Amount Shares Amount Shares Amount
Fiscal Year 2012 ............... 25 $471 — $ — 25 $471
Fiscal Year 2013 ............... 4 $ 71 22 $278 26 $349
During fiscal year 2014, we did not repurchase any shares of our common stock.
In May 2014, a special committee of our Board of Directors, on behalf of the full Board of Directors, authorized
a new program to repurchase up to $750 million of our common stock. This new stock repurchase program,
which expires on May 31, 2016, supersedes and replaces the stock repurchase authorization approved by our
Board of Directors in July 2012. Under this program, we may purchase stock in the open market or through
privately-negotiated transactions in accordance with applicable securities laws, including pursuant to pre-
arranged stock trading plans. The timing and actual amount of the stock repurchases will depend on several
factors including price, capital availability, regulatory requirements, alternative investment opportunities and
other market conditions. We are not obligated to repurchase any specific number of shares under this program
and it may be modified, suspended or discontinued at any time.
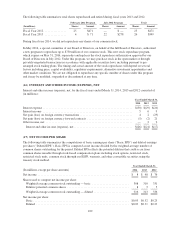
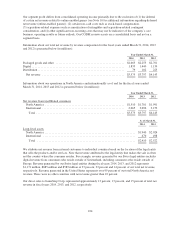
(16) INTEREST AND OTHER INCOME (EXPENSE), NET
Interest and other income (expense), net, for the fiscal years ended March 31, 2014, 2013 and 2012 consisted of
(in millions):
Year Ended March 31,
2014 2013 2012
Interest expense ............................................................. $(30) $(29) $(20)
Interest income .............................................................569
Net gain (loss) on foreign currency transactions .................................... 4 2 (29)
Net gain (loss) on foreign currency forward contracts ............................... (5) (2) 21
Other income, net ........................................................... — 2 2
Interest and other income (expense), net ........................................ $(26) $(21) $(17)
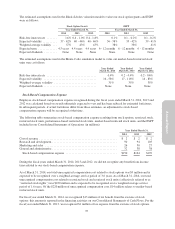
(17) NET INCOME PER SHARE
The following table summarizes the computations of basic earnings per share (“Basic EPS”) and diluted earnings
per share (“Diluted EPS”). Basic EPS is computed as net income divided by the weighted-average number of
common shares outstanding for the period. Diluted EPS reflects the potential dilution that could occur from
common shares issuable through stock-based compensation plans including stock options, restricted stock,
restricted stock units, common stock through our ESPP, warrants, and other convertible securities using the
treasury stock method.
Year Ended March 31,
(In millions, except per share amounts) 2014 2013 2012
Net income .............................................................. $ 8 $ 98 $ 76
Shares used to compute net income per share:
Weighted-average common stock outstanding — basic ......................... 308 310 331
Dilutive potential common shares ..........................................835
Weighted-average common stock outstanding — diluted ........................ 316 313 336
Net income per share:
Basic ................................................................. $0.03 $0.32 $0.23
Diluted ............................................................... $0.03 $0.31 $0.23
102