Electronic Arts 2014 Annual Report Download - page 115
Download and view the complete annual report
Please find page 115 of the 2014 Electronic Arts annual report below. You can navigate through the pages in the report by either clicking on the pages listed below, or by using the keyword search tool below to find specific information within the annual report.-
 1
1 -
2
-
3
-
4
-
5
-
6
-
7
-
8
-
9
-
10
-
11
-
12
-
13
-
14
-
15
-
16
-
17
-
18
-
19
-
20
-
21
-
22
-
23
-
24
-
25
-
26
-
27
-
28
-
29
-
30
-
31
-
32
-
33
-
34
-
35
-
36
-
37
-
38
-
39
-
40
-
41
-
42
-
43
-
44
-
45
-
46
-
47
-
48
-
49
-
50
-
51
-
52
-
53
-
54
-
55
-
56
-
57
-
58
-
59
-
60
-
61
-
62
-
63
-
64
-
65
-
66
-
67
-
68
-
69
-
70
-
71
-
72
-
73
-
74
-
75
-
76
-
77
-
78
-
79
-
80
-
81
-
82
-
83
-
84
-
85
-
86
-
87
-
88
-
89
-
90
-
91
-
92
-
93
-
94
-
95
-
96
-
97
-
98
-
99
-
100
-
101
-
102
-
103
-
104
-
 105
105 -
 106
106 -
 107
107 -
 108
108 -
 109
109 -
 110
110 -
 111
111 -
 112
112 -
 113
113 -
 114
114 -
 115
115 -
 116
116 -
 117
117 -
 118
118 -
 119
119 -
 120
120 -
 121
121 -
 122
122 -
 123
123 -
 124
124 -
 125
125 -
126
-
127
-
128
-
129
-
130
-
131
-
132
-
133
-
134
-
135
-
136
-
137
-
138
-
139
-
140
-
141
-
142
-
143
-
144
-
145
-
146
-
147
-
148
-
149
-
150
-
151
-
152
-
153
-
154
-
155
-
156
-
157
-
158
-
159
-
160
-
161
-
162
-
163
-
164
-
165
-
166
-
167
-
168
-
169
-
170
-
171
-
172
-
173
-
174
-
175
-
176
-
177
-
178
-
179
-
180
-
181
-
182
-
183
-
184
-
185
-
186
-
187
-
188
 |
 |

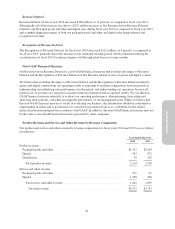
Annual Report
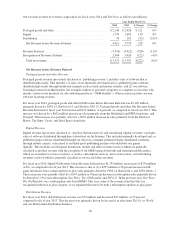
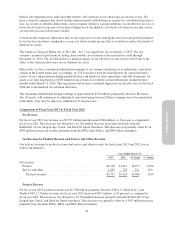
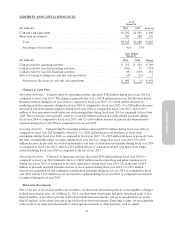
For fiscal year 2013, packaged goods and other Net Revenue before Revenue Deferral was $2,028 million,
primarily driven by FIFA 13,Madden NFL 13, and Need for Speed Most Wanted. Packaged goods and other Net
Revenue before Revenue Deferral for fiscal year 2013 decreased $708 million, or 26 percent, as compared to
fiscal year 2012. This decrease was driven by a $1,130 million decrease in sales primarily from the Battlefield
and Mass Effect franchises, as well as Star Wars: The Old Republic. This decrease was partially offset by a $422
million increase in sales primarily from the FIFA, Medal of Honor, and Dead Space franchises.
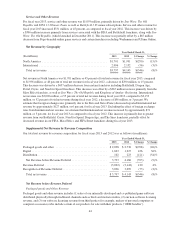
Digital Revenue
Digital revenue includes revenue from sales of our internally-developed and co-published game software
distributed through direct download through the Internet, including through our direct-to-consumer platform
Origin, or distributed wirelessly through mobile carriers. This includes our full-game downloads, mobile and
tablet revenue (each of which are generally classified as product revenue with the exception of our MMO game
downloads and freemium mobile games which are classified as service revenue) as well as subscription services,
micro-transactions, and advertising revenues (each of which is generally classified as service and other revenue).
For fiscal year 2013, digital Net Revenue before Deferral was $1,663 million, an increase of $436 million, or 36
percent, as compared to fiscal year 2012. This increase is due to (1) a $221 million or 51 percent increase in extra
content and free-to-play sales primarily driven by the FIFA and Bejeweled franchises, along with Star Wars: The
Old Republic, (2) a $136 million or 47 percent increase in subscription and advertising sales primarily driven by
Battlefield 3 Premium subscriptions,(3) an $86 million or 30 percent increase in mobile sales primarily driven by
The Simpsons: Tapped Out and FIFA World Class Soccer. These increases were partially offset by a $7 million
or 3 percent decrease in full-game download sales primarily driven by Star Wars: The Old Republic and the
Battlefield franchise.
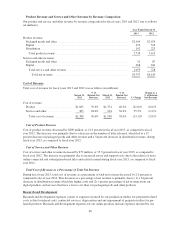
Distribution Revenue
For fiscal year 2013, distribution net revenue was $102 million and decreased $121 million, or 54 percent, as
compared to fiscal year 2012, due to a decrease in sales primarily from the Portal franchise and to a lesser extent,
our Switzerland distribution business.
Revenue Deferral
Revenue Deferral for fiscal year 2013 decreased $120 million, or 4 percent, as compared to fiscal year 2012. This
decrease was primarily due to a $708 million decrease in Net Revenue before Revenue Deferral related to our
packaged goods and other sales, which was partially offset by a higher percentage of digital sales being deferred
and recognized over time, due in part to a 51 percent increase in extra content and free-to-play sales, a 47 percent
increase in subscription and advertising revenue, a 30 percent increase in mobile sales, all of which contain an
online service component requiring revenue recognition over the period of time that the service is delivered.
Recognition of Revenue Deferral
Our non-distribution sales are generally deferred and recognized over a weighted average six-month period, and
therefore, the related revenue recognized in any fiscal year is primarily due to sales that occurred during the
respective twelve months period ended December 31. The Recognition of Revenue Deferral for fiscal year 2013
decreased $73 million, or 2 percent, as compared to fiscal year 2012. This decrease was primarily due to lower
publishing sales during the twelve months ended December 31, 2013 as compared to the same period in fiscal
year 2012.
45