Electronic Arts 2014 Annual Report Download - page 96
Download and view the complete annual report
Please find page 96 of the 2014 Electronic Arts annual report below. You can navigate through the pages in the report by either clicking on the pages listed below, or by using the keyword search tool below to find specific information within the annual report.-
 1
1 -
2
-
3
-
4
-
5
-
6
-
7
-
8
-
9
-
10
-
11
-
12
-
13
-
14
-
15
-
16
-
17
-
18
-
19
-
20
-
21
-
22
-
23
-
24
-
25
-
26
-
27
-
28
-
29
-
30
-
31
-
32
-
33
-
34
-
35
-
36
-
37
-
38
-
39
-
40
-
41
-
42
-
43
-
44
-
45
-
46
-
47
-
48
-
49
-
50
-
51
-
52
-
53
-
54
-
55
-
56
-
57
-
58
-
59
-
60
-
61
-
62
-
63
-
64
-
65
-
66
-
67
-
68
-
69
-
70
-
71
-
72
-
73
-
74
-
75
-
76
-
77
-
78
-
79
-
80
-
81
-
82
-
83
-
84
-
85
-
 86
86 -
 87
87 -
 88
88 -
 89
89 -
 90
90 -
 91
91 -
 92
92 -
 93
93 -
 94
94 -
 95
95 -
 96
96 -
 97
97 -
 98
98 -
 99
99 -
 100
100 -
 101
101 -
 102
102 -
 103
103 -
 104
104 -
 105
105 -
 106
106 -
107
-
108
-
109
-
110
-
111
-
112
-
113
-
114
-
115
-
116
-
117
-
118
-
119
-
120
-
121
-
122
-
123
-
124
-
125
-
126
-
127
-
128
-
129
-
130
-
131
-
132
-
133
-
134
-
135
-
136
-
137
-
138
-
139
-
140
-
141
-
142
-
143
-
144
-
145
-
146
-
147
-
148
-
149
-
150
-
151
-
152
-
153
-
154
-
155
-
156
-
157
-
158
-
159
-
160
-
161
-
162
-
163
-
164
-
165
-
166
-
167
-
168
-
169
-
170
-
171
-
172
-
173
-
174
-
175
-
176
-
177
-
178
-
179
-
180
-
181
-
182
-
183
-
184
-
185
-
186
-
187
-
188
 |
 |

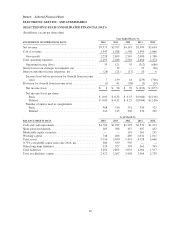
Item 6: Selected Financial Data
ELECTRONIC ARTS INC. AND SUBSIDIARIES
SELECTED FIVE-YEAR CONSOLIDATED FINANCIAL DATA
(In millions, except per share data)
Year Ended March 31,
STATEMENTS OF OPERATIONS DATA 2014 2013 2012 2011 2010
Net revenue ....................................... $3,575 $3,797 $4,143 $3,589 $3,654
Cost of revenue .................................... 1,347 1,388 1,598 1,499 1,866
Gross profit ..................................... 2,228 2,409 2,545 2,090 1,788
Total operating expenses ............................. 2,195 2,288 2,510 2,402 2,474
Operating income (loss) ........................... 33 121 35 (312) (686)
Gains (losses) on strategic investments, net .............. — 39 — 23 (26)
Interest and other income (expense), net ................. (26) (21) (17) 10 6
Income (loss) before provision for (benefit from) income
taxes ......................................... 7 139 18 (279) (706)
Provision for (benefit from) income taxes ............... (1) 41 (58) (3) (29)
Net income (loss) ................................ $ 8 $ 98 $ 76 $ (276) $ (677)
Net income (loss) per share:
Basic ........................................ $ 0.03 $ 0.32 $ 0.23 $ (0.84) $ (2.08)
Diluted ....................................... $ 0.03 $ 0.31 $ 0.23 $ (0.84) $ (2.08)
Number of shares used in computation:
Basic ........................................ 308 310 331 330 325
Diluted ....................................... 316 313 336 330 325
As of March 31,
BALANCE SHEETS DATA 2014 2013 2012 2011 2010
Cash and cash equivalents ............................ $1,782 $1,292 $1,293 $1,579 $1,273
Short-term investments .............................. 583 388 437 497 432
Marketable equity securities .......................... — — 119 161 291
Working capital .................................... 748 408 489 1,031 1,011
Total assets ....................................... 5,716 5,070 5,491 4,928 4,646
0.75% convertible senior notes due 2016, net ............. 580 559 539 — —
Other long-term liabilities ............................ 324 327 374 363 343
Total liabilities .................................... 3,294 2,803 3,033 2,364 1,917
Total stockholders’ equity ............................ 2,422 2,267 2,458 2,564 2,729
26