Electronic Arts 2014 Annual Report Download - page 107
Download and view the complete annual report
Please find page 107 of the 2014 Electronic Arts annual report below. You can navigate through the pages in the report by either clicking on the pages listed below, or by using the keyword search tool below to find specific information within the annual report.-
 1
1 -
2
-
3
-
4
-
5
-
6
-
7
-
8
-
9
-
10
-
11
-
12
-
13
-
14
-
15
-
16
-
17
-
18
-
19
-
20
-
21
-
22
-
23
-
24
-
25
-
26
-
27
-
28
-
29
-
30
-
31
-
32
-
33
-
34
-
35
-
36
-
37
-
38
-
39
-
40
-
41
-
42
-
43
-
44
-
45
-
46
-
47
-
48
-
49
-
50
-
51
-
52
-
53
-
54
-
55
-
56
-
57
-
58
-
59
-
60
-
61
-
62
-
63
-
64
-
65
-
66
-
67
-
68
-
69
-
70
-
71
-
72
-
73
-
74
-
75
-
76
-
77
-
78
-
79
-
80
-
81
-
82
-
83
-
84
-
85
-
86
-
87
-
88
-
89
-
90
-
91
-
92
-
93
-
94
-
95
-
96
-
 97
97 -
 98
98 -
 99
99 -
 100
100 -
 101
101 -
 102
102 -
 103
103 -
 104
104 -
 105
105 -
 106
106 -
 107
107 -
 108
108 -
 109
109 -
 110
110 -
 111
111 -
 112
112 -
 113
113 -
 114
114 -
 115
115 -
 116
116 -
 117
117 -
118
-
119
-
120
-
121
-
122
-
123
-
124
-
125
-
126
-
127
-
128
-
129
-
130
-
131
-
132
-
133
-
134
-
135
-
136
-
137
-
138
-
139
-
140
-
141
-
142
-
143
-
144
-
145
-
146
-
147
-
148
-
149
-
150
-
151
-
152
-
153
-
154
-
155
-
156
-
157
-
158
-
159
-
160
-
161
-
162
-
163
-
164
-
165
-
166
-
167
-
168
-
169
-
170
-
171
-
172
-
173
-
174
-
175
-
176
-
177
-
178
-
179
-
180
-
181
-
182
-
183
-
184
-
185
-
186
-
187
-
188
 |
 |

Annual Report
percent, of our total net revenue. Revenue generated by our Swiss legal entities during fiscal year 2013
represented $885 million, or 23 percent, of our total net revenue. Revenue generated in the United States
represents over 99 percent of our total North America net revenue. No other country represented greater than 10
percent of total net revenue.
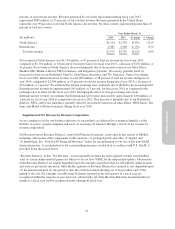
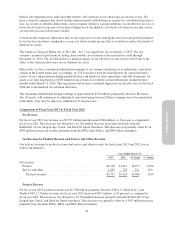
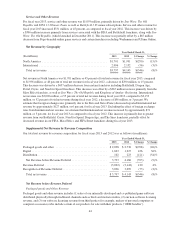
Year Ended March 31,
(In millions) 2014 2013 $ Change % Change
North America ............................................ $1,510 $1,701 $(191) (11)%
International .............................................. 2,065 2,096 $ (31) (1)%
Total net revenue ........................................ $3,575 $3,797 $(222) (6)%
Net revenue in North America was $1,510 million, or 42 percent of total net revenue for fiscal year 2014,
compared to $1,701 million, or 45 percent of total net revenue for fiscal year 2013, a decrease of $191 million, or
11 percent. Net revenue in North America decreased primarily due to decreased revenue in our Mass Effect,
Madden NFL, Medal of Honor, FIFA franchises, and Kingdoms of Amalur: Reckoning, partially offset by
increased revenue in our Battlefield, SimCity, Dead Space franchises, and The Simpsons: Tapped Out during
fiscal year 2014. International net revenue was $2,065 million, or 58 percent of total net revenue during fiscal
year 2014, compared to $2,096 million, or 55 percent of total net revenue during fiscal year 2013, a decrease of
$31 million, or 1 percent. We estimate that foreign exchange rates (primarily due to the Euro) decreased reported
International net revenue by approximately $61 million, or 3 percent, for fiscal year 2014 as compared to the
exchange rates in effect for the fiscal year 2013. Excluding the effect of foreign exchange rates from
International net revenue, we estimate that International net revenue increased by approximately $30 million, or
1 percent for fiscal year 2014 as compared to fiscal year 2013. This increase is primarily due to our Battlefield,
SimCity, FIFA, and Crysis franchises, partially offset by decreased revenue in our Mass Effect, FIFA Street, The
Sims, and Medal of Honor franchises during fiscal year 2014.
Supplemental Net Revenue by Revenue Composition
As we continue to evolve our business and more of our products are delivered to consumers digitally via the
Internet, we place a greater emphasis and focus on assessing our business through a review of net revenue by
revenue composition.
Net Revenue before Revenue Deferral, a non-GAAP financial measure, is provided in this section of MD&A,
including a discussion of the components of this measure: (1) packaged goods and other, (2) digital, and
(3) distribution. See “Non-GAAP Financial Measures” below for an explanation of our use of this non-GAAP
financial measure. A reconciliation to the corresponding measure calculated in accordance with U.S. GAAP is
provided in the discussion below.
“Revenue Deferral” in this “Net Revenue” section generally includes the unrecognized revenue from bundled
sales of certain online-enabled games for which we do not have VSOE for the unspecified updates. Fluctuations
in the Revenue Deferral are largely dependent upon the amounts of products that we sell with the online features
and services previously discussed, while the Recognition of Revenue Deferral for a period is also dependent upon
(1) the amount deferred, (2) the period of time the software-related offerings are to be provided, and (3) the
timing of the sale. For example, most Revenue Deferrals incurred in the first quarter of a fiscal year are
recognized within the same fiscal year; however, substantially all of the Revenue Deferrals incurred in the last
month of a fiscal year will be recognized in the subsequent fiscal year.
37