Electronic Arts 2014 Annual Report Download - page 121
Download and view the complete annual report
Please find page 121 of the 2014 Electronic Arts annual report below. You can navigate through the pages in the report by either clicking on the pages listed below, or by using the keyword search tool below to find specific information within the annual report.-
 1
1 -
2
-
3
-
4
-
5
-
6
-
7
-
8
-
9
-
10
-
11
-
12
-
13
-
14
-
15
-
16
-
17
-
18
-
19
-
20
-
21
-
22
-
23
-
24
-
25
-
26
-
27
-
28
-
29
-
30
-
31
-
32
-
33
-
34
-
35
-
36
-
37
-
38
-
39
-
40
-
41
-
42
-
43
-
44
-
45
-
46
-
47
-
48
-
49
-
50
-
51
-
52
-
53
-
54
-
55
-
56
-
57
-
58
-
59
-
60
-
61
-
62
-
63
-
64
-
65
-
66
-
67
-
68
-
69
-
70
-
71
-
72
-
73
-
74
-
75
-
76
-
77
-
78
-
79
-
80
-
81
-
82
-
83
-
84
-
85
-
86
-
87
-
88
-
89
-
90
-
91
-
92
-
93
-
94
-
95
-
96
-
97
-
98
-
99
-
100
-
101
-
102
-
103
-
104
-
105
-
106
-
107
-
108
-
109
-
110
-
 111
111 -
 112
112 -
 113
113 -
 114
114 -
 115
115 -
 116
116 -
 117
117 -
 118
118 -
 119
119 -
 120
120 -
 121
121 -
 122
122 -
 123
123 -
 124
124 -
 125
125 -
 126
126 -
 127
127 -
 128
128 -
 129
129 -
 130
130 -
 131
131 -
132
-
133
-
134
-
135
-
136
-
137
-
138
-
139
-
140
-
141
-
142
-
143
-
144
-
145
-
146
-
147
-
148
-
149
-
150
-
151
-
152
-
153
-
154
-
155
-
156
-
157
-
158
-
159
-
160
-
161
-
162
-
163
-
164
-
165
-
166
-
167
-
168
-
169
-
170
-
171
-
172
-
173
-
174
-
175
-
176
-
177
-
178
-
179
-
180
-
181
-
182
-
183
-
184
-
185
-
186
-
187
-
188
 |
 |

Annual Report
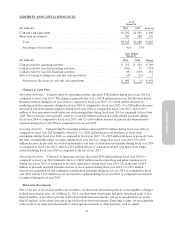
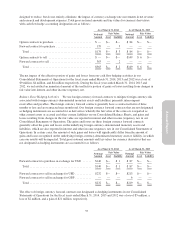
LIQUIDITY AND CAPITAL RESOURCES
As of
March 31,
Increase(In millions) 2014 2013
Cash and cash equivalents ............................................. $1,782 $1,292 $ 490
Short-term investments ............................................... 583 388 195
Total ............................................................ $2,365 $1,680 $ 685
Percentage of total assets ............................................ 41% 33%
Year Ended
March 31,
Change(In millions) 2014 2013
Cash provided by operating activities .................................... $ 712 $ 324 $388
Cash provided by (used in) investing activities ............................. (301) 32 (333)
Cash provided by (used in) financing activities ............................. 89 (345) 434
Effect of foreign exchange on cash and cash equivalents ..................... (10) (12) 2
Net increase (decrease) in cash and cash equivalents ...................... $ 490 $ (1) $491
Changes in Cash Flow
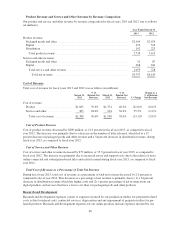
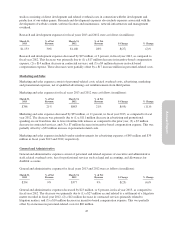
Operating Activities. Cash provided by operating activities increased $388 million during fiscal year 2014 as
compared to fiscal year 2013. The change is primarily due to (1) a $228 million increase in Net Revenue before
Revenue Deferral during fiscal year 2014 as compared to fiscal year 2013, (2) a $108 million decrease in
marketing and sales expenses during fiscal year 2014 as compared to fiscal year 2013, (3) a $28 million decrease
in research and development expenses during fiscal year 2014 as compared to fiscal year 2013, and (4) $25
million of lower payments made under our restructuring plans during fiscal year 2014 as compared to fiscal year
2013. These increases were partially offset by (1) an $80 million increase in royalty-related payments during
fiscal year 2014 as compared to fiscal year 2013, and (2) a $56 million increase in general and administrative
expenses during fiscal year 2014 as compared to fiscal year 2013.
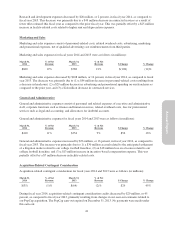
Investing Activities. Cash provided by investing activities decreased $333 million during fiscal year 2014 as
compared to fiscal year 2013 primarily driven by (1) a $186 million increase in purchases of short-term
investments during fiscal year 2014 as compared to fiscal year 2013, (2) a $72 million decrease in proceeds from
the sales of marketable equity securities during fiscal year 2014 as compared to fiscal year 2013, (3) a $58
million decrease in proceeds received from maturities and sales of short-term investments during fiscal year 2014
as compared to fiscal year 2013, and (4) a $31 million release of acquisition-related cash that was no longer
restricted during fiscal year 2014 as compared to the fiscal year 2013.
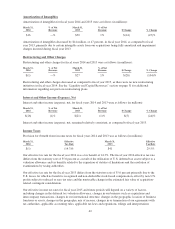
Financing Activities. Cash used in financing activities decreased $434 million during fiscal year 2014 as
compared to fiscal year 2013 primarily due to (1) $349 million used to repurchase and retire common stock
during fiscal year 2013 as compared to no stock repurchases during fiscal year 2014, (2) an increase of $43
million in proceeds received from the exercise of stock options during fiscal year 2014, (3) a $27 million
decrease in acquisition-related contingent consideration payments during fiscal year 2014 as compared to fiscal
year 2013 and (4) a $13 million excess tax benefit recognized during fiscal year 2014 as compared to no benefit
recognized during fiscal year 2013.
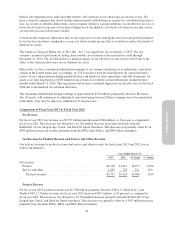
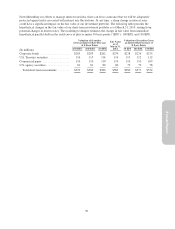
Short-term Investments
Due to our mix of fixed and variable rate securities, our short-term investment portfolio is susceptible to changes
in short-term interest rates. As of March 31, 2014, our short-term investments had gross unrealized gains of less
than $1 million, or less than 1 percent of the total in short-term investments, and gross unrealized losses of less
than $1 million, or less than 1 percent of the total in short-term investments. From time to time, we may liquidate
some or all of our short-term investments to fund operational needs or other activities, such as capital
51