Electronic Arts 2014 Annual Report Download - page 173
Download and view the complete annual report
Please find page 173 of the 2014 Electronic Arts annual report below. You can navigate through the pages in the report by either clicking on the pages listed below, or by using the keyword search tool below to find specific information within the annual report.-
 1
1 -
2
-
3
-
4
-
5
-
6
-
7
-
8
-
9
-
10
-
11
-
12
-
13
-
14
-
15
-
16
-
17
-
18
-
19
-
20
-
21
-
22
-
23
-
24
-
25
-
26
-
27
-
28
-
29
-
30
-
31
-
32
-
33
-
34
-
35
-
36
-
37
-
38
-
39
-
40
-
41
-
42
-
43
-
44
-
45
-
46
-
47
-
48
-
49
-
50
-
51
-
52
-
53
-
54
-
55
-
56
-
57
-
58
-
59
-
60
-
61
-
62
-
63
-
64
-
65
-
66
-
67
-
68
-
69
-
70
-
71
-
72
-
73
-
74
-
75
-
76
-
77
-
78
-
79
-
80
-
81
-
82
-
83
-
84
-
85
-
86
-
87
-
88
-
89
-
90
-
91
-
92
-
93
-
94
-
95
-
96
-
97
-
98
-
99
-
100
-
101
-
102
-
103
-
104
-
105
-
106
-
107
-
108
-
109
-
110
-
111
-
112
-
113
-
114
-
115
-
116
-
117
-
118
-
119
-
120
-
121
-
122
-
123
-
124
-
125
-
126
-
127
-
128
-
129
-
130
-
131
-
132
-
133
-
134
-
135
-
136
-
137
-
138
-
139
-
140
-
141
-
142
-
143
-
144
-
145
-
146
-
147
-
148
-
149
-
150
-
151
-
152
-
153
-
154
-
155
-
156
-
157
-
158
-
159
-
160
-
161
-
162
-
 163
163 -
 164
164 -
 165
165 -
 166
166 -
 167
167 -
 168
168 -
 169
169 -
 170
170 -
 171
171 -
 172
172 -
 173
173 -
 174
174 -
 175
175 -
 176
176 -
 177
177 -
 178
178 -
 179
179 -
 180
180 -
 181
181 -
 182
182 -
 183
183 -
184
-
185
-
186
-
187
-
188
 |
 |

Annual Report
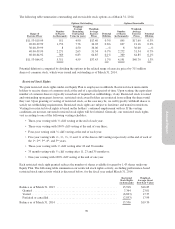
For the fiscal years ended March 31, 2014, 2013 and 2012, options to purchase, restricted stock units and
restricted stock to be released in the amount of $4 million shares, $15 million shares and $10 million shares of
common stock, respectively, were excluded from the treasury stock method computation of diluted shares as
their inclusion would have had an antidilutive effect.
Potentially dilutive shares of common stock related to our 0.75% Convertible Senior Notes due 2016 issued
during the fiscal year ended March 31, 2012, which have a conversion price of $31.74 per share and the
associated Warrants, which have a conversion price of $41.14 per share, were excluded from the computation of
Diluted EPS for the fiscal years ended March 31, 2014, 2013 and 2012 as their inclusion would have had an
antidilutive effect resulting from the conversion price. The associated Convertible Note Hedge was excluded
from the calculation of diluted shares as the impact is always considered antidilutive since the call option would
be exercised by us when the exercise price is lower than the market price. See Note 12 for additional information
related to our 0.75% Convertible Senior Notes due 2016 and related Convertible Note Hedge and Warrants.
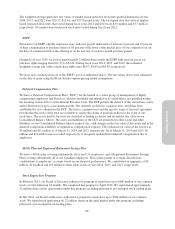
(18) SEGMENT INFORMATION
Our reporting segment is based upon: our internal organizational structure; the manner in which our operations
are managed; the criteria used by our Chief Executive Officer, our Chief Operating Decision Maker (“CODM”),
to evaluate segment performance; the availability of separate financial information; and overall materiality
considerations.
Prior to the third quarter of fiscal 2014, our “EA Labels” operating segment was comprised of our five labels: EA
Games, EA SPORTS, Maxis, PopCap and All Play. Our CODM regularly reviewed the aggregated results of the
five labels to assess overall performance and allocate resources.
In September 2013, we announced the appointment of a new Chief Executive Officer. Our new Chief Executive
Officer subsequently made a number of changes to our internal organizational structure and the manner in which
our operations are managed. In addition, we redefined our definition of segment profit for management reporting.
Our CODM currently reviews total company operating results to assess overall performance and allocate resources.
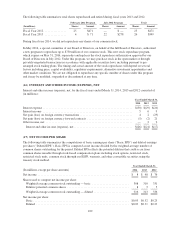
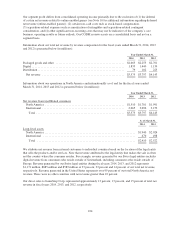
The following table summarizes the financial performance of our current segment operating profit and a
reconciliation to our consolidated operating income for the fiscal years ended March 31, 2014, 2013 and 2012. Our
current segment operating profit differs from the prior “EA Labels” segment profit primarily due to the inclusion of
(1) our Switzerland distribution revenues and expenses and (2) certain corporate and other functional costs such as
our Global Publishing and Marketing organization expenses, which were previously not allocated to the EA Labels.
Prior periods below have been restated to reflect our current reporting segment structure (in millions):
Year Ended March 31,
2014 2013 2012
Segment:
Net revenue before revenue deferral ................................... $4,021 $ 3,793 $ 4,186
Depreciation ...................................................... (126) (118) (102)
Other expenses .................................................... (3,178) (3,308) (3,687)
Segment operating profit ............................................ 717 367 397
Reconciliation to consolidated operating income:
Other:
Revenue deferral .................................................. (3,350) (3,022) (3,142)
Recognition of revenue deferral ....................................... 2,904 3,026 3,099
Amortization of intangibles .......................................... (76) (123) (95)
Acquisition-related contingent consideration ............................ 35 64 (11)
Restructuring and other charges ....................................... 1 (27) (16)
Stock-based compensation ........................................... (150) (164) (170)
Other expenses .................................................... (48) — (27)
Consolidated operating income ......................................... $ 33 $ 121 $ 35
103