Electronic Arts 2014 Annual Report Download - page 117
Download and view the complete annual report
Please find page 117 of the 2014 Electronic Arts annual report below. You can navigate through the pages in the report by either clicking on the pages listed below, or by using the keyword search tool below to find specific information within the annual report.-
 1
1 -
2
-
3
-
4
-
5
-
6
-
7
-
8
-
9
-
10
-
11
-
12
-
13
-
14
-
15
-
16
-
17
-
18
-
19
-
20
-
21
-
22
-
23
-
24
-
25
-
26
-
27
-
28
-
29
-
30
-
31
-
32
-
33
-
34
-
35
-
36
-
37
-
38
-
39
-
40
-
41
-
42
-
43
-
44
-
45
-
46
-
47
-
48
-
49
-
50
-
51
-
52
-
53
-
54
-
55
-
56
-
57
-
58
-
59
-
60
-
61
-
62
-
63
-
64
-
65
-
66
-
67
-
68
-
69
-
70
-
71
-
72
-
73
-
74
-
75
-
76
-
77
-
78
-
79
-
80
-
81
-
82
-
83
-
84
-
85
-
86
-
87
-
88
-
89
-
90
-
91
-
92
-
93
-
94
-
95
-
96
-
97
-
98
-
99
-
100
-
101
-
102
-
103
-
104
-
105
-
106
-
 107
107 -
 108
108 -
 109
109 -
 110
110 -
 111
111 -
 112
112 -
 113
113 -
 114
114 -
 115
115 -
 116
116 -
 117
117 -
 118
118 -
 119
119 -
 120
120 -
 121
121 -
 122
122 -
 123
123 -
 124
124 -
 125
125 -
 126
126 -
 127
127 -
128
-
129
-
130
-
131
-
132
-
133
-
134
-
135
-
136
-
137
-
138
-
139
-
140
-
141
-
142
-
143
-
144
-
145
-
146
-
147
-
148
-
149
-
150
-
151
-
152
-
153
-
154
-
155
-
156
-
157
-
158
-
159
-
160
-
161
-
162
-
163
-
164
-
165
-
166
-
167
-
168
-
169
-
170
-
171
-
172
-
173
-
174
-
175
-
176
-
177
-
178
-
179
-
180
-
181
-
182
-
183
-
184
-
185
-
186
-
187
-
188
 |
 |

Annual Report
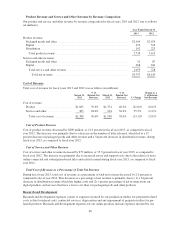
studios consisting of direct development and related overhead costs in connection with the development and
production of our online games. Research and development expenses also include expenses associated with the
development of website content, software licenses and maintenance, network infrastructure and management
overhead.
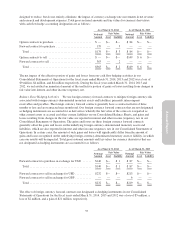
Research and development expenses for fiscal years 2013 and 2012 were as follows (in millions):
March 31,
2013
% of Net
Revenue
March 31,
2012
% of Net
Revenue $ Change % Change
$1,153 30% $1,180 28% $(27) (2)%
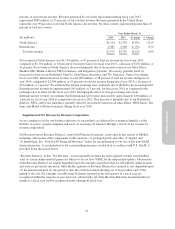
Research and development expenses decreased by $27 million, or 2 percent, in fiscal year 2013, as compared to
fiscal year 2012. This decrease was primarily due to (1) a $17 million decrease in incentive-based compensation
expense, (2) a $14 million decrease in contracted services, and (3) a $9 million decrease in stock-based
compensation expense. These decreases were partially offset by a $17 increase million in personnel-related costs.
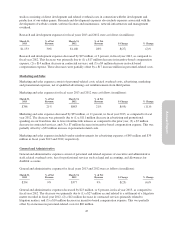
Marketing and Sales
Marketing and sales expenses consist of personnel-related costs, related overhead costs, advertising, marketing
and promotional expenses, net of qualified advertising cost reimbursements from third parties.
Marketing and sales expenses for fiscal years 2013 and 2012 were as follows (in millions):
March 31,
2013
% of Net
Revenue
March 31,
2012
% of Net
Revenue $ Change % Change
$788 21% $883 21% $(95) (11)%
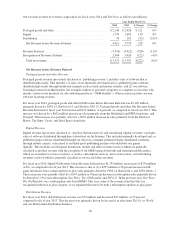
Marketing and sales expenses decreased by $95 million, or 11 percent, in fiscal year 2013, as compared to fiscal
year 2012. The decrease was primarily due to (1) a $111 million decrease in advertising and promotional
spending on our franchises due to fewer frontline title releases as compared to the prior year, (2) a $7 million
decrease in contracted services, and (3) a $7 million decrease in incentive-based compensation expense. This was
partially offset by a $29 million increase in personnel-related costs.
Marketing and sales expenses included vendor reimbursements for advertising expenses of $45 million and $39
million in fiscal years 2013 and 2012, respectively.
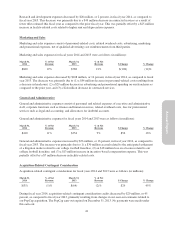
General and Administrative
General and administrative expenses consist of personnel and related expenses of executive and administrative
staff, related overhead costs, fees for professional services such as legal and accounting, and allowances for
doubtful accounts.
General and administrative expenses for fiscal years 2013 and 2012 were as follows (in millions):
March 31,
2013
% of Net
Revenue
March 31,
2012
% of Net
Revenue $ Change % Change
$354 9% $377 9% $(23) (6)%
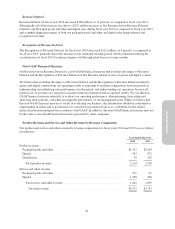
General and administrative expenses decreased by $23 million, or 6 percent, in fiscal year 2013, as compared to
fiscal year 2012. The decrease was primarily due to (1) a $27 million accrual related to a settlement of a litigation
matter recorded in fiscal year 2012, (2) a $12 million decrease in contracted services primarily related to
litigation matters, and (3) a $10 million decrease in incentive-based compensation expense. This was partially
offset by an increase in personnel-related costs for $26 million.
47