Electronic Arts 2014 Annual Report Download - page 175
Download and view the complete annual report
Please find page 175 of the 2014 Electronic Arts annual report below. You can navigate through the pages in the report by either clicking on the pages listed below, or by using the keyword search tool below to find specific information within the annual report.-
 1
1 -
2
-
3
-
4
-
5
-
6
-
7
-
8
-
9
-
10
-
11
-
12
-
13
-
14
-
15
-
16
-
17
-
18
-
19
-
20
-
21
-
22
-
23
-
24
-
25
-
26
-
27
-
28
-
29
-
30
-
31
-
32
-
33
-
34
-
35
-
36
-
37
-
38
-
39
-
40
-
41
-
42
-
43
-
44
-
45
-
46
-
47
-
48
-
49
-
50
-
51
-
52
-
53
-
54
-
55
-
56
-
57
-
58
-
59
-
60
-
61
-
62
-
63
-
64
-
65
-
66
-
67
-
68
-
69
-
70
-
71
-
72
-
73
-
74
-
75
-
76
-
77
-
78
-
79
-
80
-
81
-
82
-
83
-
84
-
85
-
86
-
87
-
88
-
89
-
90
-
91
-
92
-
93
-
94
-
95
-
96
-
97
-
98
-
99
-
100
-
101
-
102
-
103
-
104
-
105
-
106
-
107
-
108
-
109
-
110
-
111
-
112
-
113
-
114
-
115
-
116
-
117
-
118
-
119
-
120
-
121
-
122
-
123
-
124
-
125
-
126
-
127
-
128
-
129
-
130
-
131
-
132
-
133
-
134
-
135
-
136
-
137
-
138
-
139
-
140
-
141
-
142
-
143
-
144
-
145
-
146
-
147
-
148
-
149
-
150
-
151
-
152
-
153
-
154
-
155
-
156
-
157
-
158
-
159
-
160
-
161
-
162
-
163
-
164
-
 165
165 -
 166
166 -
 167
167 -
 168
168 -
 169
169 -
 170
170 -
 171
171 -
 172
172 -
 173
173 -
 174
174 -
 175
175 -
 176
176 -
 177
177 -
 178
178 -
 179
179 -
 180
180 -
 181
181 -
 182
182 -
 183
183 -
 184
184 -
 185
185 -
186
-
187
-
188
 |
 |

Annual Report
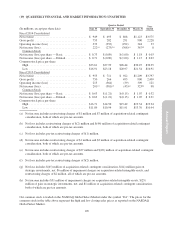
(19) QUARTERLY FINANCIAL AND MARKET INFORMATION (UNAUDITED)
Quarter Ended Year
Ended(In millions, except per share data) June 30 September 30 December 31 March 31
Fiscal 2014 Consolidated
Net revenue ................................... $ 949 $ 695 $ 808 $1,123 $3,575
Gross profit ................................... 755 282 291 900 2,228
Operating income (loss) ......................... 233 (252) (292) 344 33
Net income (loss) ............................... 222
(a) (273)(b) (308)(c) 367(d) 8
Common Stock
Net income (loss) per share — Basic ............... $ 0.73 $ (0.89) $ (1.00) $ 1.18 $ 0.03
Net income (loss) per share — Diluted .............. $ 0.71 $ (0.89) $ (1.00) $ 1.15 $ 0.03
Common stock price per share
High ....................................... $23.61 $27.99 $26.44 $30.25 $30.25
Low ....................................... $16.91 $23.18 $20.97 $21.54 $16.91
Fiscal 2013 Consolidated
Net revenue ................................... $ 955 $ 711 $ 922 $1,209 $3,797
Gross profit ................................... 750 266 493 900 2,409
Operating income (loss) ......................... 215 (364) (39) 309 121
Net income (loss) ............................... 201
(e) (381)(f) (45)(g) 323(h) 98
Common Stock
Net income (loss) per share — Basic ............... $ 0.63 $ (1.21) $ (0.15) $ 1.07 $ 0.32
Net income (loss) per share — Diluted .............. $ 0.63 $ (1.21) $ (0.15) $ 1.05 $ 0.31
Common stock price per share
High ....................................... $16.71 $14.50 $15.42 $19.34 $19.34
Low ....................................... $11.89 $10.94 $11.91 $13.70 $10.94
(a) Net income includes restructuring charges of $1 million and $7 million of acquisition-related contingent
consideration, both of which are pre-tax amounts.
(b) Net loss includes restructuring charges of $(2) million and $(44) million of acquisition-related contingent
consideration, both of which are pre-tax amounts.
(c) Net loss includes pre-tax restructuring charges of $(1) million.
(d) Net income includes restructuring charges of $1 million and $2 million of acquisition-related contingent
consideration, both of which are pre-tax amounts.
(e) Net income includes restructuring charges of $27 million and $(20) million of acquisition-related contingent
consideration, both of which are pre-tax amounts.
(f) Net loss includes pre-tax restructuring charges of $(2) million.
(g) Net loss includes $(45) million of acquisition-related contingent consideration, $(14) million gain on
strategic investments, net, $6 million of impairment charges on acquisition-related intangible assets, and
restructuring charges of $2 million, all of which are pre-tax amounts.
(h) Net income includes $31 million of impairment charges on acquisition-related intangible assets, $(25)
million of gain on strategic investments, net, and $1 million of acquisition-related contingent consideration,
both of which are pre-tax amounts.
Our common stock is traded on the NASDAQ Global Select Market under the symbol “EA”. The prices for the
common stock in the table above represent the high and low closing sales prices as reported on the NASDAQ
Global Select Market.
105