Electronic Arts 2014 Annual Report Download - page 36
Download and view the complete annual report
Please find page 36 of the 2014 Electronic Arts annual report below. You can navigate through the pages in the report by either clicking on the pages listed below, or by using the keyword search tool below to find specific information within the annual report.-
 1
1 -
2
-
3
-
4
-
5
-
6
-
7
-
8
-
9
-
10
-
11
-
12
-
13
-
14
-
15
-
16
-
17
-
18
-
19
-
20
-
21
-
22
-
23
-
24
-
25
-
 26
26 -
 27
27 -
 28
28 -
 29
29 -
 30
30 -
 31
31 -
 32
32 -
 33
33 -
 34
34 -
 35
35 -
 36
36 -
 37
37 -
 38
38 -
 39
39 -
 40
40 -
 41
41 -
 42
42 -
 43
43 -
 44
44 -
 45
45 -
 46
46 -
47
-
48
-
49
-
50
-
51
-
52
-
53
-
54
-
55
-
56
-
57
-
58
-
59
-
60
-
61
-
62
-
63
-
64
-
65
-
66
-
67
-
68
-
69
-
70
-
71
-
72
-
73
-
74
-
75
-
76
-
77
-
78
-
79
-
80
-
81
-
82
-
83
-
84
-
85
-
86
-
87
-
88
-
89
-
90
-
91
-
92
-
93
-
94
-
95
-
96
-
97
-
98
-
99
-
100
-
101
-
102
-
103
-
104
-
105
-
106
-
107
-
108
-
109
-
110
-
111
-
112
-
113
-
114
-
115
-
116
-
117
-
118
-
119
-
120
-
121
-
122
-
123
-
124
-
125
-
126
-
127
-
128
-
129
-
130
-
131
-
132
-
133
-
134
-
135
-
136
-
137
-
138
-
139
-
140
-
141
-
142
-
143
-
144
-
145
-
146
-
147
-
148
-
149
-
150
-
151
-
152
-
153
-
154
-
155
-
156
-
157
-
158
-
159
-
160
-
161
-
162
-
163
-
164
-
165
-
166
-
167
-
168
-
169
-
170
-
171
-
172
-
173
-
174
-
175
-
176
-
177
-
178
-
179
-
180
-
181
-
182
-
183
-
184
-
185
-
186
-
187
-
188
 |
 |
EXECUTIVE COMPENSATION
COMPENSATION DISCUSSION AND ANALYSIS
This Compensation Discussion and Analysis describes the fiscal 2014 compensation paid to our named executive
officers (“NEOs”), the compensation decisions made by our Compensation Committee (the “Committee”), and
the financial, strategic, and operational performance factors that guided those decisions. Our NEOs for fiscal
2014 were:
• Lawrence F. Probst III, Executive Chairman;
• Andrew Wilson, Chief Executive Officer;
• Blake Jorgensen, Executive Vice President, Chief Financial Officer;
• Frank D. Gibeau, Executive Vice President, EA Mobile;
• Peter Moore, Executive Vice President, Chief Operating Officer; and
• Patrick Söderlund, Executive Vice President, EA Studios.
FISCAL 2014 SUMMARY
Fiscal 2014 was a year of dramatic changes for the gaming industry and for EA. We saw the launch of
Microsoft’s Xbox One and Sony’s PlayStation 4 “next generation” video game console systems, continued
growth in mobile gaming and leadership changes within the Company. In the midst of these changes, we were
able to deliver both amazing games and services to our consumers and strong financial results to our
stockholders.
EA established an early lead on the next generation consoles and maintained that leadership position in 2014 with
40% segment share across North America and Europe. We accomplished these results while at the same time
reducing operating expenses through disciplined cost management. We finished fiscal 2014 in a strong position;
we were able to exceed our revenue and earnings per share guidance, drive higher gross margins, lower our
operating expenses, double our cash provided by operations, and invest in new products and services for the
future. In fiscal 2014, our share price increased by 61%, and, in May 2014, we implemented a new $750 million
share repurchase program as part of our commitment to return value to our shareholders.
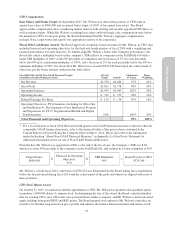
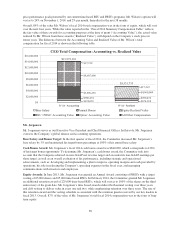
Financial and Operating Highlights:
• We generated $4.02 billion in non-GAAP net revenue and delivered $1.69 in non-GAAP diluted earnings
per share.
• Our digital non-GAAP net revenue increased to approximately $1.8 billion in fiscal 2014.
• Our mobile business delivered approximately $460 million in non-GAAP net revenue in the fiscal year,
reaching more than 130 million monthly active users.
• Cash provided by operations for the fiscal year was $712 million.
• We improved our non-GAAP operating profit margins to 18%.
On a GAAP basis in fiscal 2014, we achieved net revenue of $3.6 billion, diluted earnings per share of $0.03, and
digital net revenue of $1.8 billion. Our fiscal 2014 GAAP operating income was $33 million, creating GAAP
operating profit margins of 1%. Additionally, our mobile business generated $406 million of GAAP net revenue
in fiscal 2014. Appendix A to this Proxy Statement includes a reconciliation of the non-GAAP financial
measures referenced above to the most directly comparable GAAP financial measures.
Executive Leadership Changes
In the first two quarters of fiscal 2014, our Executive Chairman, Lawrence Probst III, served as the Company’s
principal executive officer, while we conducted an extensive internal and external search for a new CEO. In
30