Electronic Arts 2014 Annual Report Download - page 111
Download and view the complete annual report
Please find page 111 of the 2014 Electronic Arts annual report below. You can navigate through the pages in the report by either clicking on the pages listed below, or by using the keyword search tool below to find specific information within the annual report.-
 1
1 -
2
-
3
-
4
-
5
-
6
-
7
-
8
-
9
-
10
-
11
-
12
-
13
-
14
-
15
-
16
-
17
-
18
-
19
-
20
-
21
-
22
-
23
-
24
-
25
-
26
-
27
-
28
-
29
-
30
-
31
-
32
-
33
-
34
-
35
-
36
-
37
-
38
-
39
-
40
-
41
-
42
-
43
-
44
-
45
-
46
-
47
-
48
-
49
-
50
-
51
-
52
-
53
-
54
-
55
-
56
-
57
-
58
-
59
-
60
-
61
-
62
-
63
-
64
-
65
-
66
-
67
-
68
-
69
-
70
-
71
-
72
-
73
-
74
-
75
-
76
-
77
-
78
-
79
-
80
-
81
-
82
-
83
-
84
-
85
-
86
-
87
-
88
-
89
-
90
-
91
-
92
-
93
-
94
-
95
-
96
-
97
-
98
-
99
-
100
-
 101
101 -
 102
102 -
 103
103 -
 104
104 -
 105
105 -
 106
106 -
 107
107 -
 108
108 -
 109
109 -
 110
110 -
 111
111 -
 112
112 -
 113
113 -
 114
114 -
 115
115 -
 116
116 -
 117
117 -
 118
118 -
 119
119 -
 120
120 -
 121
121 -
122
-
123
-
124
-
125
-
126
-
127
-
128
-
129
-
130
-
131
-
132
-
133
-
134
-
135
-
136
-
137
-
138
-
139
-
140
-
141
-
142
-
143
-
144
-
145
-
146
-
147
-
148
-
149
-
150
-
151
-
152
-
153
-
154
-
155
-
156
-
157
-
158
-
159
-
160
-
161
-
162
-
163
-
164
-
165
-
166
-
167
-
168
-
169
-
170
-
171
-
172
-
173
-
174
-
175
-
176
-
177
-
178
-
179
-
180
-
181
-
182
-
183
-
184
-
185
-
186
-
187
-
188
 |
 |

Annual Report
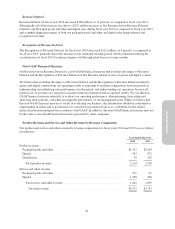
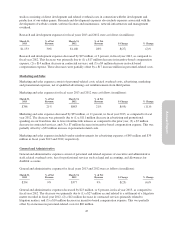
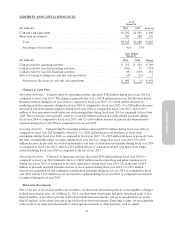
Research and development expenses decreased by $28 million, or 2 percent, in fiscal year 2014, as compared to
fiscal year 2013. This decrease was primarily due to a $49 million decrease in contracted services as a result of
fewer titles released this fiscal year as compared to the prior fiscal year. This was partially offset by a $25 million
increase in facility-related costs related to higher rent and depreciation expenses.
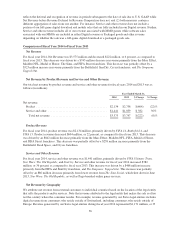
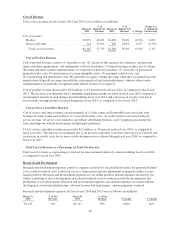
Marketing and Sales
Marketing and sales expenses consist of personnel-related costs, related overhead costs, advertising, marketing
and promotional expenses, net of qualified advertising cost reimbursements from third parties.
Marketing and sales expenses for fiscal years 2014 and 2013 were as follows (in millions):
March 31,
2014
% of Net
Revenue
March 31,
2013
% of Net
Revenue $ Change % Change
$680 19% $788 21% $(108) (14)%
Marketing and sales expenses decreased by $108 million, or 14 percent, in fiscal year 2014, as compared to fiscal
year 2013. The decrease was primarily due to (1) a $54 million decrease in personnel-related costs resulting from
a decrease in headcount, (2) a $29 million decrease in advertising and promotional spending on our franchises as
compared to the prior year, and (3) a $24 million decrease in contracted services.
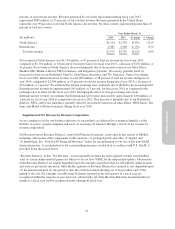
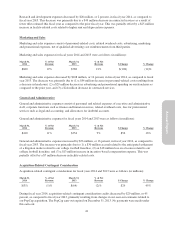
General and Administrative
General and administrative expenses consist of personnel and related expenses of executive and administrative
staff, corporate functions such as finance and human resources, related overhead costs, fees for professional
services such as legal and accounting, and allowances for doubtful accounts.
General and administrative expenses for fiscal years 2014 and 2013 were as follows (in millions):
March 31,
2014
% of Net
Revenue
March 31,
2013
% of Net
Revenue $ Change % Change
$410 11% $354 9% $56 16%
General and administrative expenses increased by $56 million, or 16 percent, in fiscal year 2014, as compared to
fiscal year 2013. The increase was primarily due to (1) a $30 million accrual related to the anticipated settlement
of a litigation matter related to our college football franchise, (2) an $18 million loss on a license related to our
college football franchise, and (3) a $13 million increase in incentive-based compensation expense. This was
partially offset by a $7 million decrease in facility-related costs.
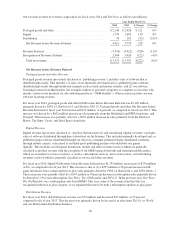
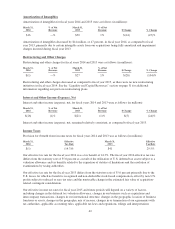
Acquisition-Related Contingent Consideration
Acquisition-related contingent consideration for fiscal years 2014 and 2013 were as follows (in millions):
March 31,
2014
% of Net
Revenue
March 31,
2013
% of Net
Revenue $ Change % Change
$(35) (1)% $(64) (2)% $29 45%
During fiscal year 2014, acquisition-related contingent consideration credits decreased by $29 million, or 45
percent, as compared to fiscal year 2013, primarily resulting from changes in our earn-out estimates related to
our PopCap acquisition. The PopCap earn-out expired on December 31, 2013. No payments were made under
this earn-out.
41