Electronic Arts 2014 Annual Report Download - page 119
Download and view the complete annual report
Please find page 119 of the 2014 Electronic Arts annual report below. You can navigate through the pages in the report by either clicking on the pages listed below, or by using the keyword search tool below to find specific information within the annual report.-
 1
1 -
2
-
3
-
4
-
5
-
6
-
7
-
8
-
9
-
10
-
11
-
12
-
13
-
14
-
15
-
16
-
17
-
18
-
19
-
20
-
21
-
22
-
23
-
24
-
25
-
26
-
27
-
28
-
29
-
30
-
31
-
32
-
33
-
34
-
35
-
36
-
37
-
38
-
39
-
40
-
41
-
42
-
43
-
44
-
45
-
46
-
47
-
48
-
49
-
50
-
51
-
52
-
53
-
54
-
55
-
56
-
57
-
58
-
59
-
60
-
61
-
62
-
63
-
64
-
65
-
66
-
67
-
68
-
69
-
70
-
71
-
72
-
73
-
74
-
75
-
76
-
77
-
78
-
79
-
80
-
81
-
82
-
83
-
84
-
85
-
86
-
87
-
88
-
89
-
90
-
91
-
92
-
93
-
94
-
95
-
96
-
97
-
98
-
99
-
100
-
101
-
102
-
103
-
104
-
105
-
106
-
107
-
108
-
 109
109 -
 110
110 -
 111
111 -
 112
112 -
 113
113 -
 114
114 -
 115
115 -
 116
116 -
 117
117 -
 118
118 -
 119
119 -
 120
120 -
 121
121 -
 122
122 -
 123
123 -
 124
124 -
 125
125 -
 126
126 -
 127
127 -
 128
128 -
 129
129 -
130
-
131
-
132
-
133
-
134
-
135
-
136
-
137
-
138
-
139
-
140
-
141
-
142
-
143
-
144
-
145
-
146
-
147
-
148
-
149
-
150
-
151
-
152
-
153
-
154
-
155
-
156
-
157
-
158
-
159
-
160
-
161
-
162
-
163
-
164
-
165
-
166
-
167
-
168
-
169
-
170
-
171
-
172
-
173
-
174
-
175
-
176
-
177
-
178
-
179
-
180
-
181
-
182
-
183
-
184
-
185
-
186
-
187
-
188
 |
 |

Annual Report
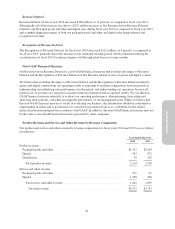
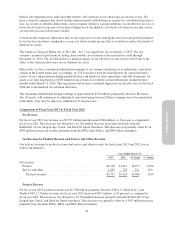
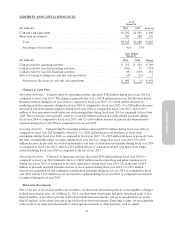
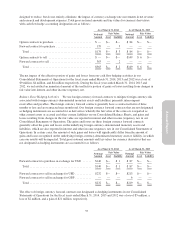
Interest and Other Income (Expense), Net
Interest and other income (expense), net, for fiscal years 2013 and 2012 were as follows (in millions):
March 31,
2013
% of Net
Revenue
March 31,
2012
% of Net
Revenue $ Change % Change
$(21) (1)% $(17) —% $(4) (24)%
Interest and other income (expense), net increased by $4 million, or 24 percent, during fiscal year 2013 as
compared to the fiscal year 2012, primarily due to (1) a $22 million change due to a $1 million loss in the current
year compared to a $21 million gain in the prior year in foreign currency forward contract gains and losses, (2) a
$9 million increase in interest expense, including the amortization of debt discount recognized in connection with
our 0.75% Convertible Senior Notes due 2016, and (3) a $3 million decrease in interest income as a result of
decreasing average cash balances. This was partially offset by a $31 million increase in foreign currency
transaction gains as compared to the same period in the prior year.
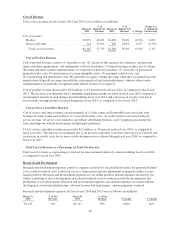
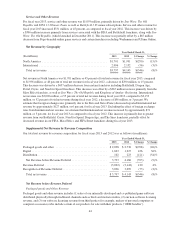
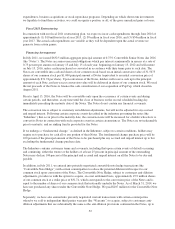
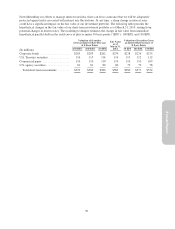
Income Taxes
Provision for (benefit from) income taxes for fiscal years 2013 and 2012 was as follows (in millions):
March 31,
2013
Effective
Tax Rate
March 31,
2012
Effective
Tax Rate
$41 29.5% $(58) (322.2)%
Our effective tax rate for the fiscal year 2013 was a tax expense of 29.5%. The fiscal year 2013 effective tax rate
differs from the statutory rate of 35.0 percent primarily due to the U.S. losses for which no benefit is recognized
and non-deductible stock-based compensation, offset by non-U.S. profits subject to reduced or zero tax rates and
the nontaxable change in the estimated fair value of acquisition-related contingent consideration.
Our effective tax rate for the fiscal year 2012 was a tax benefit of 322.2 percent. In fiscal year 2012, we recorded
approximately $58 million of additional net deferred tax liabilities related to the PopCap and KlickNation
Corporation (“KlickNation”) acquisitions. These additional deferred tax liabilities create a new source of taxable
income, thereby requiring us to release a portion of our deferred tax asset valuation allowance with a related
reduction in income tax expense of $58 million. In addition, during the three months ended March 31, 2012, we
recorded $48 million of additional tax benefits related to the expiration of statutes of limitations in non-U.S. tax
jurisdictions.
The fiscal year 2012 effective tax rate differs from the statutory rate of 35.0 percent as a result of the utilization
of U.S. deferred tax assets subject to a valuation allowance and non-U.S. profits subject to a reduced or zero tax
rate, partially offset by non-deductible stock-based compensation. In addition, the fiscal year 2012 effective tax
rate is impacted by tax benefits related to the expiration of statutes of limitations and the resolution of
examinations by taxing authorities, as well as a reduction in the U.S. valuation allowance related to the PopCap
and KlickNation acquisitions.
Impact of Recently Issued Accounting Standards
In April 2014, the FASB issued ASU 2014-08, Presentation of Financial Statements (Topic 205) and Property,
Plant, and Equipment (Topic 360). The amendments of this ASU require that only the disposals representing a
strategic shift in operations should be presented as discontinued operations. Those strategic shifts should have a
major effect on the organization’s operations and financial results. The disclosure requirements will be effective
for annual periods (and interim periods within those annual periods) beginning after December 15, 2014, and will
require prospective application. Early adoption is permitted. We expect to adopt this new standard in the first
quarter of fiscal year 2016. We do not expect the adoption to have a material impact on our Consolidated
Financial Statements.
49