Electronic Arts 2014 Annual Report Download - page 174
Download and view the complete annual report
Please find page 174 of the 2014 Electronic Arts annual report below. You can navigate through the pages in the report by either clicking on the pages listed below, or by using the keyword search tool below to find specific information within the annual report.-
 1
1 -
2
-
3
-
4
-
5
-
6
-
7
-
8
-
9
-
10
-
11
-
12
-
13
-
14
-
15
-
16
-
17
-
18
-
19
-
20
-
21
-
22
-
23
-
24
-
25
-
26
-
27
-
28
-
29
-
30
-
31
-
32
-
33
-
34
-
35
-
36
-
37
-
38
-
39
-
40
-
41
-
42
-
43
-
44
-
45
-
46
-
47
-
48
-
49
-
50
-
51
-
52
-
53
-
54
-
55
-
56
-
57
-
58
-
59
-
60
-
61
-
62
-
63
-
64
-
65
-
66
-
67
-
68
-
69
-
70
-
71
-
72
-
73
-
74
-
75
-
76
-
77
-
78
-
79
-
80
-
81
-
82
-
83
-
84
-
85
-
86
-
87
-
88
-
89
-
90
-
91
-
92
-
93
-
94
-
95
-
96
-
97
-
98
-
99
-
100
-
101
-
102
-
103
-
104
-
105
-
106
-
107
-
108
-
109
-
110
-
111
-
112
-
113
-
114
-
115
-
116
-
117
-
118
-
119
-
120
-
121
-
122
-
123
-
124
-
125
-
126
-
127
-
128
-
129
-
130
-
131
-
132
-
133
-
134
-
135
-
136
-
137
-
138
-
139
-
140
-
141
-
142
-
143
-
144
-
145
-
146
-
147
-
148
-
149
-
150
-
151
-
152
-
153
-
154
-
155
-
156
-
157
-
158
-
159
-
160
-
161
-
162
-
163
-
 164
164 -
 165
165 -
 166
166 -
 167
167 -
 168
168 -
 169
169 -
 170
170 -
 171
171 -
 172
172 -
 173
173 -
 174
174 -
 175
175 -
 176
176 -
 177
177 -
 178
178 -
 179
179 -
 180
180 -
 181
181 -
 182
182 -
 183
183 -
 184
184 -
185
-
186
-
187
-
188
 |
 |

Our segment profit differs from consolidated operating income primarily due to the exclusion of (1) the deferral
of certain net revenue related to online-enabled games (see Note 10 for additional information regarding deferred
net revenue (online-enabled games)), (2) certain non-cash costs such as stock-based compensation,
(3) acquisition-related expenses such as amortization of intangibles and acquisition-related contingent
consideration, and (4) other significant non-recurring costs that may not be indicative of the company’s core
business, operating results or future outlook. Our CODM reviews assets on a consolidated basis and not on a
segment basis.
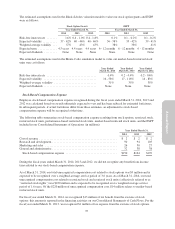
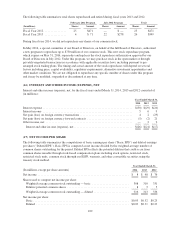
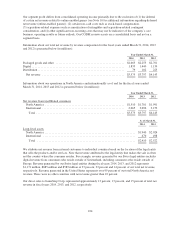
Information about our total net revenue by revenue composition for the fiscal years ended March 31, 2014, 2013
and 2012 is presented below (in millions):
Year Ended March 31,
2014 2013 2012
Packaged goods and other ............................................... $1,663 $2,255 $2,761
Digital ............................................................... 1,833 1,440 1,159
Distribution ........................................................... 79 102 223
Net revenue ........................................................ $3,575 $3,797 $4,143
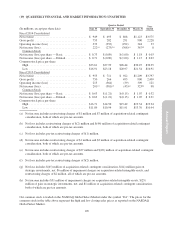
Information about our operations in North America and internationally as of and for the fiscal years ended
March 31, 2014, 2013 and 2012 is presented below (in millions):
Year Ended March 31,
2014 2013 2012
Net revenue from unaffiliated customers
North America ...................................................... $1,510 $1,701 $1,991
International ........................................................ 2,065 2,096 2,152
Total ............................................................ $3,575 $3,797 $4,143
As of March 31,
2014 2013
Long-lived assets
North America .............................................................. $1,940 $2,024
International ............................................................... 470 498
Total ................................................................... $2,410 $2,522
We attribute net revenue from external customers to individual countries based on the location of the legal entity
that sells the products and/or services. Note that revenue attributed to the legal entity that makes the sale is often
not the country where the consumer resides. For example, revenue generated by our Swiss legal entities includes
digital revenue from consumers who reside outside of Switzerland, including consumers who reside outside of
Europe. Revenue generated by our Swiss legal entities during fiscal years 2014, 2013, and 2012 represents
$1,171 million, $885 million and $589 million or 33 percent, 23 percent and 14 percent of our total net revenue,
respectively. Revenue generated in the United States represents over 99 percent of our total North America net
revenue. There were no other countries with net revenue greater than 10 percent.
Our direct sales to GameStop Corp. represented approximately 13 percent, 13 percent, and 15 percent of total net
revenue in fiscal years 2014, 2013, and 2012, respectively.
104