Electronic Arts 2014 Annual Report Download - page 57
Download and view the complete annual report
Please find page 57 of the 2014 Electronic Arts annual report below. You can navigate through the pages in the report by either clicking on the pages listed below, or by using the keyword search tool below to find specific information within the annual report.-
 1
1 -
2
-
3
-
4
-
5
-
6
-
7
-
8
-
9
-
10
-
11
-
12
-
13
-
14
-
15
-
16
-
17
-
18
-
19
-
20
-
21
-
22
-
23
-
24
-
25
-
26
-
27
-
28
-
29
-
30
-
31
-
32
-
33
-
34
-
35
-
36
-
37
-
38
-
39
-
40
-
41
-
42
-
43
-
44
-
45
-
46
-
 47
47 -
 48
48 -
 49
49 -
 50
50 -
 51
51 -
 52
52 -
 53
53 -
 54
54 -
 55
55 -
 56
56 -
 57
57 -
 58
58 -
 59
59 -
 60
60 -
 61
61 -
 62
62 -
 63
63 -
 64
64 -
 65
65 -
 66
66 -
 67
67 -
68
-
69
-
70
-
71
-
72
-
73
-
74
-
75
-
76
-
77
-
78
-
79
-
80
-
81
-
82
-
83
-
84
-
85
-
86
-
87
-
88
-
89
-
90
-
91
-
92
-
93
-
94
-
95
-
96
-
97
-
98
-
99
-
100
-
101
-
102
-
103
-
104
-
105
-
106
-
107
-
108
-
109
-
110
-
111
-
112
-
113
-
114
-
115
-
116
-
117
-
118
-
119
-
120
-
121
-
122
-
123
-
124
-
125
-
126
-
127
-
128
-
129
-
130
-
131
-
132
-
133
-
134
-
135
-
136
-
137
-
138
-
139
-
140
-
141
-
142
-
143
-
144
-
145
-
146
-
147
-
148
-
149
-
150
-
151
-
152
-
153
-
154
-
155
-
156
-
157
-
158
-
159
-
160
-
161
-
162
-
163
-
164
-
165
-
166
-
167
-
168
-
169
-
170
-
171
-
172
-
173
-
174
-
175
-
176
-
177
-
178
-
179
-
180
-
181
-
182
-
183
-
184
-
185
-
186
-
187
-
188
 |
 |

Proxy Statement
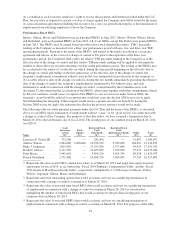
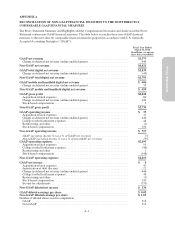
Outstanding Stock Awards
Time-Based Vesting
Awards
Performance-Based Vesting
Awards
Name
Grant
Date
Number of
Shares or
Units of
Stock
That Have
Not
Vested
(#)
Market
Value of
Shares
or Units
of Stock
That
have
Not
Vested
($)
Equity
Incentive
Plan
Awards:
Number of
Unearned
Shares, Units
or Other
Rights That
Have Not
Vested
(#)
Equity
Incentive
Plan Awards:
Market or
Payout Value
of Unearned
Shares, Units
or Other
Rights That
Have Not
Vested ($)
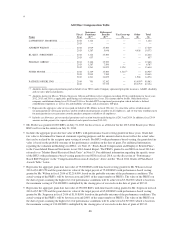
Lawrence F. Probst III .................................. 7/31/2013 10,000(1) 285,300 — —
Andrew Wilson ........................................ 6/18/2012 — — 100,000(2) 2,853,000
6/17/2013 — — 75,000(3) 2,139,750
6/16/2011 33,334(4) 951,019 — —
6/18/2012 50,000(4) 1,426,500 — —
7/27/2012 225,000(5) 6,419,250 — —
6/17/2013 75,000(4) 2,139,750 — —
Blake J. Jorgensen ..................................... 6/17/2013 — — 65,000(3) 1,854,450
9/17/2012 150,000(6) 4,279,500 — —
6/17/2013 65,000(4) 1,854,450 — —
2/18/2014 225,000(7) 6,419,250 — —
Frank D. Gibeau ....................................... 6/16/2011 — — 33,334(8) 951,005
6/18/2012 — — 133,334(2) 3,804,019
6/17/2013 — — 100,000(3) 2,853,000
6/16/2011 33,334(4) 951,019 — —
7/27/2012 66,667(9) 1,902,010 — —
7/27/2012 300,000(5) 8,559,000 — —
6/17/2013 100,000(4) 2,853,000 — —
Peter Moore .......................................... 6/16/2011 — — 21,667(8) 618,160
6/18/2012 — — 100,000(2) 2,853,000
6/17/2013 — — 65,000(3) 1,854,450
6/16/2011 21,667(4) 618,160 — —
6/18/2012 50,000(4) 1,426,500 — —
6/17/2013 65,000(4) 1,854,450 — —
Patrick Söderlund ...................................... 6/16/2011 — — 25,000(8) 713,250
6/18/2012 — — 100,000(2) 2,853,000
6/17/2013 — — 75,000(3) 2,139,750
6/16/2011 25,000(4) 713,250 — —
6/18/2012 50,000(4) 1,426,500 — —
7/27/2012 225,000(5) 6,419,250 — —
6/17/2013 75,000(4) 2,139,750 — —
(1) Mr. Probst was granted 10,000 RSUs on July 31, 2013 for his services as a Director for the 2013-2014 Board year. These RSUs will vest
as to 100% of the units on July 31, 2014.
(2) Represents RSUs with performance-based vesting at the maximum achievement level of 200% of target. The PRSUs granted to our NEOs
in fiscal 2013 are referred to as “Market-Based Restricted Stock Units” in Note 15 “Stock-Based Compensation and Employee Benefit
Plans”, to the Consolidated Financial Statements in our 2014 Annual Report. The number of RSUs that vest will be based on EA’s total
stockholder return (“TSR”) relative to the performance of those companies in the NASDAQ-100 Index on April 1, 2012 (the “Fiscal 2013
NASDAQ-100”). The TSR for the Company and the Fiscal 2013 NASDAQ 100 will be measured over a three-year performance period
covering fiscal 2013 through 2015, with one year (fiscal 2013), two year (fiscal 2013 and 2014) and three year (fiscal 2013, 2014 and
2015) TSR measurement periods. The TSR for each measurement period will be calculated using a 90-day trailing average of the closing
stock prices of the Fiscal 2013 NASDAQ-100 at the end of each measurement period as compared to the 90-day trailing average of the
closing stock prices of the Fiscal 2013 NASDAQ-100 for the first 90 days of the measurement period. The actual number of shares that
vest will be determined by the Compensation Committee based on the relative TSR for each measurement period and will range from zero
to 200% of the target amount. In order to vest in 100% of the target number of PRSUs, the Company’s TSR needs to be at the 60th
percentile of the TSR of the Fiscal 2013 NASDAQ-100. In order to vest in 200% of the target number of PRSUs, the Company’s TSR
needs to be at or above the 94th percentile of the TSR of the Fiscal 2013 NASDAQ-100.
51