Electronic Arts 2014 Annual Report Download - page 169
Download and view the complete annual report
Please find page 169 of the 2014 Electronic Arts annual report below. You can navigate through the pages in the report by either clicking on the pages listed below, or by using the keyword search tool below to find specific information within the annual report.-
 1
1 -
2
-
3
-
4
-
5
-
6
-
7
-
8
-
9
-
10
-
11
-
12
-
13
-
14
-
15
-
16
-
17
-
18
-
19
-
20
-
21
-
22
-
23
-
24
-
25
-
26
-
27
-
28
-
29
-
30
-
31
-
32
-
33
-
34
-
35
-
36
-
37
-
38
-
39
-
40
-
41
-
42
-
43
-
44
-
45
-
46
-
47
-
48
-
49
-
50
-
51
-
52
-
53
-
54
-
55
-
56
-
57
-
58
-
59
-
60
-
61
-
62
-
63
-
64
-
65
-
66
-
67
-
68
-
69
-
70
-
71
-
72
-
73
-
74
-
75
-
76
-
77
-
78
-
79
-
80
-
81
-
82
-
83
-
84
-
85
-
86
-
87
-
88
-
89
-
90
-
91
-
92
-
93
-
94
-
95
-
96
-
97
-
98
-
99
-
100
-
101
-
102
-
103
-
104
-
105
-
106
-
107
-
108
-
109
-
110
-
111
-
112
-
113
-
114
-
115
-
116
-
117
-
118
-
119
-
120
-
121
-
122
-
123
-
124
-
125
-
126
-
127
-
128
-
129
-
130
-
131
-
132
-
133
-
134
-
135
-
136
-
137
-
138
-
139
-
140
-
141
-
142
-
143
-
144
-
145
-
146
-
147
-
148
-
149
-
150
-
151
-
152
-
153
-
154
-
155
-
156
-
157
-
158
-
 159
159 -
 160
160 -
 161
161 -
 162
162 -
 163
163 -
 164
164 -
 165
165 -
 166
166 -
 167
167 -
 168
168 -
 169
169 -
 170
170 -
 171
171 -
 172
172 -
 173
173 -
 174
174 -
 175
175 -
 176
176 -
 177
177 -
 178
178 -
 179
179 -
180
-
181
-
182
-
183
-
184
-
185
-
186
-
187
-
188
 |
 |

Annual Report
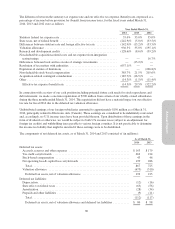
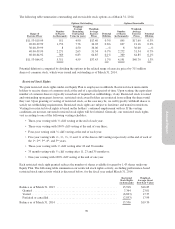
The following table summarizes outstanding and exercisable stock options as of March 31, 2014:
Options Outstanding Options Exercisable
Range of
Exercise Prices
Number
of Shares
(in thousands)
Weighted-
Average
Remaining
Contractual
Term (in years)
Weighted-
Average
Exercise
Prices
Potential
Dilution
Number
of Shares
(in thousands)
Weighted-
Average
Exercise
Prices
Potential
Dilution
$11.53-$19.99 911 4.90 $17.40 0.3% 845 $17.69 0.3%
20.00-29.99 1,752 7.76 24.03 0.6% 697 21.16 0.2%
30.00-39.99 8 4.50 36.00 —% 8 36.00 —%
40.00-59.99 2,271 2.63 51.34 0.7% 2,272 51.34 0.7%
60.00-64.92 369 0.83 64.85 0.1% 369 64.85 0.1%
$11.53-$64.92 5,311 4.59 $37.43 1.7% 4,191 $40.70 1.3%
Potential dilution is computed by dividing the options in the related range of exercise prices by 311 million
shares of common stock, which were issued and outstanding as of March 31, 2014.
Restricted Stock Rights
We grant restricted stock rights under our Equity Plan to employees worldwide. Restricted stock units entitle
holders to receive shares of common stock at the end of a specified period of time. Upon vesting, the equivalent
number of common shares is typically issued net of required tax withholdings, if any. Restricted stock is issued
and outstanding upon grant; however, restricted stock award holders are restricted from selling the shares until
they vest. Upon granting or vesting of restricted stock, as the case may be, we will typically withhold shares to
satisfy tax withholding requirements. Restricted stock rights are subject to forfeiture and transfer restrictions.
Vesting for restricted stock rights is based on the holders’ continued employment with us. If the vesting
conditions are not met, unvested restricted stock rights will be forfeited. Generally, our restricted stock rights
vest according to one of the following vesting schedules:
• Three-year vesting with
1
⁄
3
cliff vesting at the end of each year;
• Three-year vesting with 100% cliff vesting at the end of year three;
• Four-year vesting with
1
⁄
4
cliff vesting at the end of each year;
• Five-year vesting with
1
⁄
9
,
2
⁄
9
,
3
⁄
9
,
2
⁄
9
and
1
⁄
9
of the shares cliff vesting respectively at the end of each of
the 1st,2
nd,3
rd,4
th, and 5th years;
• Three-year vesting with
1
⁄
2
cliff vesting after 18 and 36 months;
• 35 month vesting with
1
⁄
3
cliff vesting after 11, 23 and 35 months or;
• One-year vesting with 100% cliff vesting at the end of one year.
Each restricted stock right granted reduces the number of shares available for grant by 1.43 shares under our
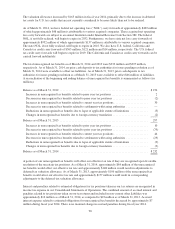
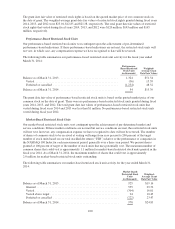
Equity Plan. The following table summarizes our restricted stock rights activity, excluding performance-based
restricted stock unit activity which is discussed below, for the fiscal year ended March 31, 2014:
Restricted
Stock Rights
(in thousands)
Weighted-
Average Grant
Date Fair Values
Balance as of March 31, 2013 ......................................... 15,918 $16.85
Granted ......................................................... 7,364 23.01
Vested .......................................................... (6,893) 17.37
Forfeited or cancelled .............................................. (2,853) 17.99
Balance as of March 31, 2014 ......................................... 13,536 $19.70
99