Electronic Arts 2014 Annual Report Download - page 97
Download and view the complete annual report
Please find page 97 of the 2014 Electronic Arts annual report below. You can navigate through the pages in the report by either clicking on the pages listed below, or by using the keyword search tool below to find specific information within the annual report.-
 1
1 -
2
-
3
-
4
-
5
-
6
-
7
-
8
-
9
-
10
-
11
-
12
-
13
-
14
-
15
-
16
-
17
-
18
-
19
-
20
-
21
-
22
-
23
-
24
-
25
-
26
-
27
-
28
-
29
-
30
-
31
-
32
-
33
-
34
-
35
-
36
-
37
-
38
-
39
-
40
-
41
-
42
-
43
-
44
-
45
-
46
-
47
-
48
-
49
-
50
-
51
-
52
-
53
-
54
-
55
-
56
-
57
-
58
-
59
-
60
-
61
-
62
-
63
-
64
-
65
-
66
-
67
-
68
-
69
-
70
-
71
-
72
-
73
-
74
-
75
-
76
-
77
-
78
-
79
-
80
-
81
-
82
-
83
-
84
-
85
-
86
-
 87
87 -
 88
88 -
 89
89 -
 90
90 -
 91
91 -
 92
92 -
 93
93 -
 94
94 -
 95
95 -
 96
96 -
 97
97 -
 98
98 -
 99
99 -
 100
100 -
 101
101 -
 102
102 -
 103
103 -
 104
104 -
 105
105 -
 106
106 -
 107
107 -
108
-
109
-
110
-
111
-
112
-
113
-
114
-
115
-
116
-
117
-
118
-
119
-
120
-
121
-
122
-
123
-
124
-
125
-
126
-
127
-
128
-
129
-
130
-
131
-
132
-
133
-
134
-
135
-
136
-
137
-
138
-
139
-
140
-
141
-
142
-
143
-
144
-
145
-
146
-
147
-
148
-
149
-
150
-
151
-
152
-
153
-
154
-
155
-
156
-
157
-
158
-
159
-
160
-
161
-
162
-
163
-
164
-
165
-
166
-
167
-
168
-
169
-
170
-
171
-
172
-
173
-
174
-
175
-
176
-
177
-
178
-
179
-
180
-
181
-
182
-
183
-
184
-
185
-
186
-
187
-
188
 |
 |

Annual Report
Item 7: Management’s Discussion and Analysis of Financial Condition and Results of Operations
OVERVIEW
The following overview is a high-level discussion of our operating results, as well as some of the trends and
drivers that affect our business. Management believes that an understanding of these trends and drivers is
important in order to understand our results for the fiscal year ended March 31, 2014, as well as our future
prospects. This summary is not intended to be exhaustive, nor is it intended to be a substitute for the detailed
discussion and analysis provided elsewhere in this Form 10-K, including in the “Business” section and the “Risk
Factors” above, the remainder of this “Management’s Discussion and Analysis of Financial Condition and
Results of Operations (“MD&A”)”, and the Consolidated Financial Statements and related Notes.
About Electronic Arts
We develop, market, publish and distribute game software content and services that can be played by consumers
on a variety of platforms, including video game consoles (such as PlayStation 3 and 4 from Sony and Xbox 360
and Xbox One from Microsoft), personal computers, mobile phones and tablets. Our ability to deliver games and
services across multiple platforms, through multiple distribution channels, and directly to consumers (online and
wirelessly) has been, and will continue to be, a cornerstone of our product strategy. We have adopted new
business models and alternative revenue streams (such as subscription, micro-transactions, and advertising) in
connection with our online and wireless product and service offerings. Some of our games are based on our
wholly-owned intellectual property (e.g., Battlefield, Mass Effect, Need for Speed, Dragon Age, The Sims,
Bejeweled, and Plants vs. Zombies), and some of our games are based on content that we license from others
(e.g., FIFA, Madden NFL and Star Wars). Our goal is to turn our intellectual properties into year-round
businesses available on a range of platforms. Our products and services may be purchased through physical and
online retailers, platform providers such as console manufacturers and mobile carriers via digital downloads, as
well as directly through our own distribution platform, including online portals such as Origin.
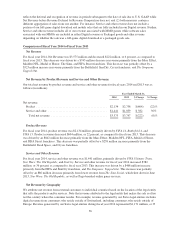
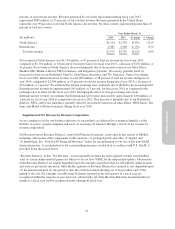
Financial Results
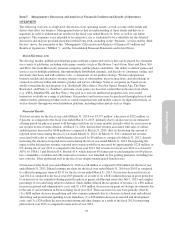
Total net revenue for the fiscal year ended March 31, 2014 was $3,575 million, a decrease of $222 million, or
6 percent, as compared to the fiscal year ended March 31, 2013, primarily due to an increase in our estimated
offering period for physical games sold through retail from six to nine months, partially offset by an increase in
net revenue before revenue deferral. At March 31, 2014, deferred net revenue associated with sales of online-
enabled games increased by $446 million as compared to March 31, 2013, directly decreasing the amount of
reported net revenue during the fiscal year ended March 31, 2014. At March 31, 2013, deferred net revenue
associated with sales of online-enabled games decreased by $4 million as compared to March 31, 2012, directly
increasing the amount of reported net revenue during the fiscal year ended March 31, 2013. Disregarding the
impact of the deferred net revenue, reported net revenue would have increased by approximately $228 million, or
6%, during fiscal year 2014 as compared to the fiscal year 2013. Net revenue for fiscal year 2014 was driven by
FIFA 14,FIFA 13 and Battlefield 4. Battlefield 4, which delivers 60 frames-per-second gameplay for 64 players,
two commanders on tablets and other innovative features, was launched on five gaming platforms, including two
new consoles. It has performed well in the fiscal year despite unanticipated launch issues.
Net income for the fiscal year ended March 31, 2014 was $8 million as compared to $98 million for the fiscal year
ended March 31, 2013. Diluted earnings per share for the fiscal year ended March 31, 2014 was $0.03 as compared
to a diluted earnings per share of $0.31 for the fiscal year ended March 31, 2013. Net income decreased for fiscal
year 2014 as compared to the fiscal year 2013 primarily as a result of (1) a $181 million decrease in gross profit due
to an increase in our estimated offering period for physical games sold through retail after July 1, 2013 and a higher
percentage of our sales being subject to deferral, which further delayed the recognition of revenue, (2) a $56 million
increase in general and administrative costs, and (3) a $39 million decrease in our gains on strategic investments due
to the sale of our investment in Neowiz during fiscal year 2013. These increases in costs were partially offset by
(1) a $108 million decrease in marketing and sales expenses primarily due to a decrease in headcount and reduced
advertising and promotional spending on our franchises, (2) a $28 million decrease in research and development
costs, and (3) a $28 million decrease in restructuring and other charges as a result of the fiscal 2013 restructuring
plan in fiscal year 2013 as compared to none in fiscal year 2014.
27