Electronic Arts 2014 Annual Report Download - page 145
Download and view the complete annual report
Please find page 145 of the 2014 Electronic Arts annual report below. You can navigate through the pages in the report by either clicking on the pages listed below, or by using the keyword search tool below to find specific information within the annual report.-
 1
1 -
2
-
3
-
4
-
5
-
6
-
7
-
8
-
9
-
10
-
11
-
12
-
13
-
14
-
15
-
16
-
17
-
18
-
19
-
20
-
21
-
22
-
23
-
24
-
25
-
26
-
27
-
28
-
29
-
30
-
31
-
32
-
33
-
34
-
35
-
36
-
37
-
38
-
39
-
40
-
41
-
42
-
43
-
44
-
45
-
46
-
47
-
48
-
49
-
50
-
51
-
52
-
53
-
54
-
55
-
56
-
57
-
58
-
59
-
60
-
61
-
62
-
63
-
64
-
65
-
66
-
67
-
68
-
69
-
70
-
71
-
72
-
73
-
74
-
75
-
76
-
77
-
78
-
79
-
80
-
81
-
82
-
83
-
84
-
85
-
86
-
87
-
88
-
89
-
90
-
91
-
92
-
93
-
94
-
95
-
96
-
97
-
98
-
99
-
100
-
101
-
102
-
103
-
104
-
105
-
106
-
107
-
108
-
109
-
110
-
111
-
112
-
113
-
114
-
115
-
116
-
117
-
118
-
119
-
120
-
121
-
122
-
123
-
124
-
125
-
126
-
127
-
128
-
129
-
130
-
131
-
132
-
133
-
134
-
 135
135 -
 136
136 -
 137
137 -
 138
138 -
 139
139 -
 140
140 -
 141
141 -
 142
142 -
 143
143 -
 144
144 -
 145
145 -
 146
146 -
 147
147 -
 148
148 -
 149
149 -
 150
150 -
 151
151 -
 152
152 -
 153
153 -
 154
154 -
 155
155 -
156
-
157
-
158
-
159
-
160
-
161
-
162
-
163
-
164
-
165
-
166
-
167
-
168
-
169
-
170
-
171
-
172
-
173
-
174
-
175
-
176
-
177
-
178
-
179
-
180
-
181
-
182
-
183
-
184
-
185
-
186
-
187
-
188
 |
 |

Annual Report
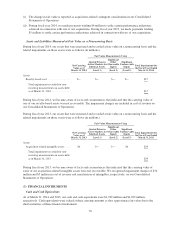
Fair Value Measurements at Reporting
Date Using
As of
March 31,
2013
Quoted Prices
in Active
Markets for
Identical
Financial
Instruments
Significant
Other
Observable
Inputs
Significant
Unobservable
Inputs
(Level 1) (Level 2) (Level 3) Balance Sheet Classification
Assets
Money market funds ............... $469 $469 $ — $ — Cash equivalents
Available-for-sale securities:
Corporate bonds ................ 178 — 178 — Short-term investments
U.S. agency securities ............ 91 — 91 — Short-term investments and
cash equivalents
U.S. Treasury securities .......... 88 88 — — Short-term investments and
cash equivalents
Commercial paper ............... 73 — 73 — Short-term investments and
cash equivalents
Deferred compensation plan assets(a) . . 11 11 — — Other assets
Foreign currency derivatives ........ 6 — 6 — Other current assets
Total assets at fair value .......... $916 $568 $348 $ —
Liabilities
Contingent consideration(b) .......... $ 43 $ — $ — $ 43 Accruedandothercurrent
liabilities and other liabilities
Deferred compensation plan
liabilities(a) .................... 12 12 — — Other liabilities
Total liabilities at fair value ....... $ 55 $ 12 $ — $ 43
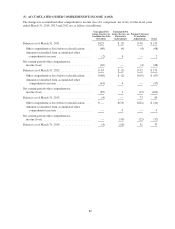
Fair Value Measurements Using Significant
Unobservable Inputs (Level 3)
Contingent
Consideration
Balance as of March 31, 2012 ...................................... $112
Change in fair value(c) ........................................... (64)
Payments(d) ................................................... (5)
Balance as of March 31, 2013 ...................................... $ 43
(a) The Deferred Compensation Plan assets consist of various mutual funds. See Note 15 for additional
information regarding our Deferred Compensation Plan.
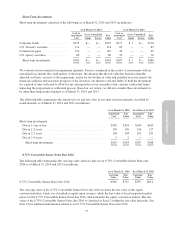
(b) The contingent consideration as of March 31, 2014 represents the estimated fair value of the additional
variable cash consideration payable in connection with our acquisitions of KlickNation Corporation
(“KlickNation”) and Chillingo Limited (“Chillingo”) that are contingent upon the achievement of certain
performance milestones. The contingent consideration as of March 31, 2013 represents the estimated fair
value of the additional variable cash consideration payable in connection with our acquisitions of PopCap
Games, Inc. (“PopCap”), KlickNation and Chillingo that are contingent upon the achievement of certain
performance milestones. We estimated the fair value of the acquisition-related contingent consideration
payable using probability-weighted discounted cash flow models, and applied a discount rate that
appropriately captures the risk associated with the obligation. The weighted average of the discount rates
used during the fiscal year 2014 was 18 percent. The weighted average of the discount rates used during the
fiscal year 2013 was 13 percent. The significant unobservable input used in the fair value measurement of
the contingent consideration payable are forecasted earnings. Significant changes in forecasted earnings
would result in a significantly higher or lower fair value measurement. At March 31, 2014 and March 31,
2013, the fair market value of acquisition-related contingent consideration totaled $4 million and $43
million, respectively, compared to a maximum potential payout of $10 million and $566 million,
respectively.
75