Electronic Arts 2014 Annual Report Download - page 168
Download and view the complete annual report
Please find page 168 of the 2014 Electronic Arts annual report below. You can navigate through the pages in the report by either clicking on the pages listed below, or by using the keyword search tool below to find specific information within the annual report.-
 1
1 -
2
-
3
-
4
-
5
-
6
-
7
-
8
-
9
-
10
-
11
-
12
-
13
-
14
-
15
-
16
-
17
-
18
-
19
-
20
-
21
-
22
-
23
-
24
-
25
-
26
-
27
-
28
-
29
-
30
-
31
-
32
-
33
-
34
-
35
-
36
-
37
-
38
-
39
-
40
-
41
-
42
-
43
-
44
-
45
-
46
-
47
-
48
-
49
-
50
-
51
-
52
-
53
-
54
-
55
-
56
-
57
-
58
-
59
-
60
-
61
-
62
-
63
-
64
-
65
-
66
-
67
-
68
-
69
-
70
-
71
-
72
-
73
-
74
-
75
-
76
-
77
-
78
-
79
-
80
-
81
-
82
-
83
-
84
-
85
-
86
-
87
-
88
-
89
-
90
-
91
-
92
-
93
-
94
-
95
-
96
-
97
-
98
-
99
-
100
-
101
-
102
-
103
-
104
-
105
-
106
-
107
-
108
-
109
-
110
-
111
-
112
-
113
-
114
-
115
-
116
-
117
-
118
-
119
-
120
-
121
-
122
-
123
-
124
-
125
-
126
-
127
-
128
-
129
-
130
-
131
-
132
-
133
-
134
-
135
-
136
-
137
-
138
-
139
-
140
-
141
-
142
-
143
-
144
-
145
-
146
-
147
-
148
-
149
-
150
-
151
-
152
-
153
-
154
-
155
-
156
-
157
-
 158
158 -
 159
159 -
 160
160 -
 161
161 -
 162
162 -
 163
163 -
 164
164 -
 165
165 -
 166
166 -
 167
167 -
 168
168 -
 169
169 -
 170
170 -
 171
171 -
 172
172 -
 173
173 -
 174
174 -
 175
175 -
 176
176 -
 177
177 -
 178
178 -
179
-
180
-
181
-
182
-
183
-
184
-
185
-
186
-
187
-
188
 |
 |

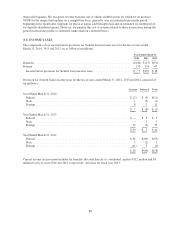
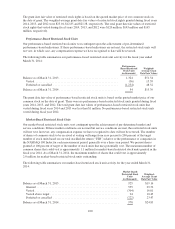
net of $1 million of deferred tax write-offs. There was no tax benefit related to stock-based compensation
reported in the financing activities on our Consolidated Statements of Cash Flows. For the fiscal year ended
March 31, 2012, we recognized $3 million of tax benefit from the exercise of stock options, net of $1 million of
deferred tax write-offs; of this amount $4 million of excess tax benefit related to stock-based compensation was
reported in the financing activities on our Consolidated Statements of Cash Flows.
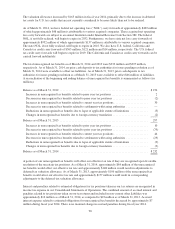
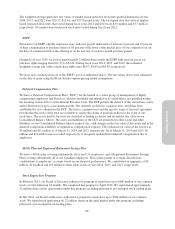
Summary of Plans and Plan Activity
Equity Incentive Plans
Our 2000 Equity Incentive Plan (the “Equity Plan”) allows us to grant options to purchase our common stock and
to grant restricted stock, restricted stock units and stock appreciation rights to our employees, officers and
directors. Pursuant to the Equity Plan, incentive stock options may be granted to employees and officers and non-
qualified options may be granted to employees, officers and directors, at not less than 100 percent of the fair
market value on the date of grant.
Options granted under the Equity Plan generally expire ten years from the date of grant and are generally
exercisable as to 24 percent of the shares after 12 months, and then ratably over the following 38 months.
At our Annual Meeting of Stockholders, held on July 31, 2013, our stockholders approved (a) amendments to our
2000 Equity Incentive Plan (the “Equity Plan”) to increase the number of shares of common stock authorized
under the Equity Plan by 18 million shares, and to increase the limit on the number of shares that may be covered
by equity awards to new employees under the Equity Plan from a maximum of 2 million shares in the fiscal year
of hire to 4 million shares in the fiscal year of hire, and (b) an amendment to the ESPP to increase the number of
shares authorized under the ESPP by 7 million shares. A total of 24.2 million options or 17.0 million restricted
stock units were available for grant under our Equity Plan as of March 31, 2014.
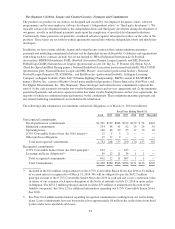
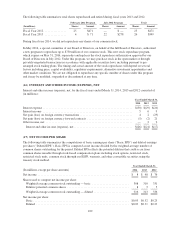
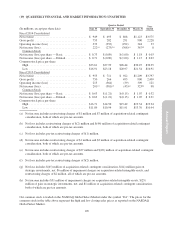
Stock Options
The following table summarizes our stock option activity for the fiscal year ended March 31, 2014:
Options
(in thousands)
Weighted-
Average
Exercise Prices
Weighted-
Average
Remaining
Contractual
Term (in years)
Aggregate
Intrinsic Value
(in millions)
Outstanding as of March 31, 2013 .............. 7,802 $34.17
Granted ................................. 1,013 26.21
Exercised ................................ (2,445) 18.09
Forfeited, cancelled or expired ............... (1,059) 47.31
Outstanding as of March 31, 2014 .............. 5,311 $37.43 4.59 $18
Vested and expected to vest ................... 5,096 $37.92 4.38 $17
Exercisable as of March 31, 2014 ............... 4,191 $40.70 3.31 $14
As of March 31, 2014, the weighted-average remaining contractual term for our stock options outstanding was
4.59 years and the aggregate intrinsic value of our stock options outstanding was $18 million. The aggregate
intrinsic value represents the total pre-tax intrinsic value based on our closing stock price as of March 31, 2014,
which would have been received by the option holders had all the option holders exercised their options as of that
date. The weighted-average grant date fair values of stock options granted during fiscal years 2014, 2013, and
2012 were $8.61, $4.64 and $7.27, respectively. The total intrinsic values of stock options exercised during fiscal
years 2014 and 2012 were $16 million and $4 million, respectively, and immaterial for fiscal year 2013. The total
estimated fair values (determined as of the grant date) of stock options vested during fiscal years 2014, 2013 and
2012 were $2 million, $11 million and $15 million, respectively. We issue new common stock from our
authorized shares upon the exercise of stock options.
98