Electronic Arts 2014 Annual Report Download - page 47
Download and view the complete annual report
Please find page 47 of the 2014 Electronic Arts annual report below. You can navigate through the pages in the report by either clicking on the pages listed below, or by using the keyword search tool below to find specific information within the annual report.-
 1
1 -
2
-
3
-
4
-
5
-
6
-
7
-
8
-
9
-
10
-
11
-
12
-
13
-
14
-
15
-
16
-
17
-
18
-
19
-
20
-
21
-
22
-
23
-
24
-
25
-
26
-
27
-
28
-
29
-
30
-
31
-
32
-
33
-
34
-
35
-
36
-
 37
37 -
 38
38 -
 39
39 -
 40
40 -
 41
41 -
 42
42 -
 43
43 -
 44
44 -
 45
45 -
 46
46 -
 47
47 -
 48
48 -
 49
49 -
 50
50 -
 51
51 -
 52
52 -
 53
53 -
 54
54 -
 55
55 -
 56
56 -
 57
57 -
58
-
59
-
60
-
61
-
62
-
63
-
64
-
65
-
66
-
67
-
68
-
69
-
70
-
71
-
72
-
73
-
74
-
75
-
76
-
77
-
78
-
79
-
80
-
81
-
82
-
83
-
84
-
85
-
86
-
87
-
88
-
89
-
90
-
91
-
92
-
93
-
94
-
95
-
96
-
97
-
98
-
99
-
100
-
101
-
102
-
103
-
104
-
105
-
106
-
107
-
108
-
109
-
110
-
111
-
112
-
113
-
114
-
115
-
116
-
117
-
118
-
119
-
120
-
121
-
122
-
123
-
124
-
125
-
126
-
127
-
128
-
129
-
130
-
131
-
132
-
133
-
134
-
135
-
136
-
137
-
138
-
139
-
140
-
141
-
142
-
143
-
144
-
145
-
146
-
147
-
148
-
149
-
150
-
151
-
152
-
153
-
154
-
155
-
156
-
157
-
158
-
159
-
160
-
161
-
162
-
163
-
164
-
165
-
166
-
167
-
168
-
169
-
170
-
171
-
172
-
173
-
174
-
175
-
176
-
177
-
178
-
179
-
180
-
181
-
182
-
183
-
184
-
185
-
186
-
187
-
188
 |
 |

Proxy Statement
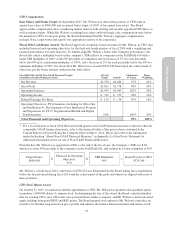
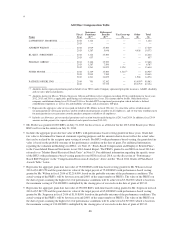
Executive Bonus Plan
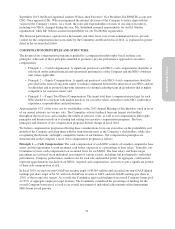
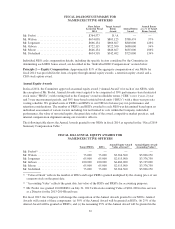
Cash bonus awards for each of our NEOs were funded under the Electronic Arts Inc. Executive Bonus Plan (the
“Executive Bonus Plan”), which was approved by stockholders in 2012. Cash bonuses payable under this plan
are intended to qualify as tax deductible “performance-based compensation” under Section 162(m) of the Internal
Revenue Code. At the beginning of the fiscal year, the Committee selected the Executive Bonus Plan
participants, performance period, performance measures, and the formula used to determine maximum bonus
funding. In fiscal 2014, all of our NEOs were selected to participate in this plan. The performance period was
established as fiscal 2014 and the formula to determine the maximum bonus funding for each NEO was the lower
of: (1) 300% of their annual base salary and (2) 0.5% of our fiscal 2014 non-GAAP net income for each NEO
other than our Executive Chairman and CEO, for whom the maximum was 1% of our fiscal 2014 non-GAAP net
income. The Committee selected non-GAAP net income as the performance measure because the level of
profitability is a key business focus in any year. For fiscal 2014, the Company reported non-GAAP net income of
$534 million, which resulted in the maximum bonus award funding of 300% of annual base salary for each of our
NEOs. The Committee then exercised its discretion to reduce the actual bonus awards for each individual based
on Company’s overall financial performance, each NEO’s target bonus award and individual performance
against strategic and operational objectives, as discussed in “Individual NEO Compensation” above.
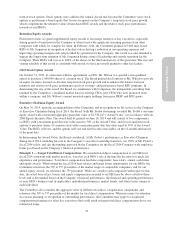
Performance-Based RSU Program
The Committee began granting PRSUs as part of the annual equity awards to Executive Vice President level
employees and above, beginning in fiscal 2012. The actual number of PRSUs earned from these grants range
from zero to 200% of the target award based on the Company’s TSR relative to the performance of each of the
companies in the NASDAQ-100 Index over a three-year performance period with vesting opportunities at one-
year, two-year, and three-year measurement periods. TSR is determined based on a 90-day trailing average of the
closing stock prices of the NASDAQ-100 at the end of each measurement period as compared to the 90-day
average of the closing stock prices of the NASDAQ-100 at the beginning of the performance period. For each
measurement period, the Company’s TSR must be at the 60th percentile of the TSR of companies in the
NASDAQ-100 in order for 100% of the target award to vest. If the Company’s TSR is above or below the 60th
percentile, the number of shares that vest will increase by 3% for each percentile above the 60th, or decrease by
2% for each percentile below the 60th.
In fiscal 2014 the Company utilized the same basic PRSU design as in fiscal 2013, but with two changes. First,
the Company added a restriction on vesting during a measurement period, such that if the Company’s TSR was
negative the maximum number of shares that can be earned is capped at 100% of the target award for that
measurement period. Second, if less than the target number of shares are earned during the one-year or two-year
measurement periods, up to the target number of shares remaining from those periods can be earned in a
subsequent measurement period (i.e. the two-year or three-year measurement period) if the Company’s stock
price performance during the course of the performance period results in an improved cumulative TSR percentile
relative to the NASDAQ-100. The Committee added this feature to the PRSU program as an incentive to keep
our executives focused on improving stock price performance over the longer-term.
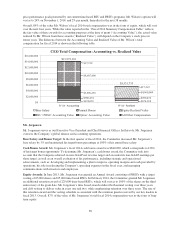
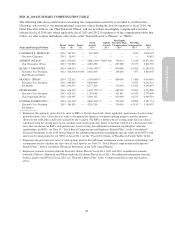
As reflected in the table below, the percentage of PRSUs vesting for each measurement period ending with fiscal
2014 is aligned with the relative performance of our stock price.
PRSU Grant date June 2011 June 2012 June 2013
Performance Period Fiscal 12-14 Fiscal 13-15 Fiscal 14-16
90 day average stock price (start of performance period) $17.79 $14.26 $20.35
Measurement Period 3 Year 2 Year 1 Year
90 day average stock price (end of measurement period) $26.64
EA’s Total Stockholder Return (“TSR”) 49.8% 86.9% 30.9%
EA’s TSR Percentile vs. NASDAQ 100 51st 83rd 73rd
Percentage of Target Shares Vesting in May 2014 82% 169% 139%
41