Electronic Arts 2014 Annual Report Download - page 113
Download and view the complete annual report
Please find page 113 of the 2014 Electronic Arts annual report below. You can navigate through the pages in the report by either clicking on the pages listed below, or by using the keyword search tool below to find specific information within the annual report.-
 1
1 -
2
-
3
-
4
-
5
-
6
-
7
-
8
-
9
-
10
-
11
-
12
-
13
-
14
-
15
-
16
-
17
-
18
-
19
-
20
-
21
-
22
-
23
-
24
-
25
-
26
-
27
-
28
-
29
-
30
-
31
-
32
-
33
-
34
-
35
-
36
-
37
-
38
-
39
-
40
-
41
-
42
-
43
-
44
-
45
-
46
-
47
-
48
-
49
-
50
-
51
-
52
-
53
-
54
-
55
-
56
-
57
-
58
-
59
-
60
-
61
-
62
-
63
-
64
-
65
-
66
-
67
-
68
-
69
-
70
-
71
-
72
-
73
-
74
-
75
-
76
-
77
-
78
-
79
-
80
-
81
-
82
-
83
-
84
-
85
-
86
-
87
-
88
-
89
-
90
-
91
-
92
-
93
-
94
-
95
-
96
-
97
-
98
-
99
-
100
-
101
-
102
-
 103
103 -
 104
104 -
 105
105 -
 106
106 -
 107
107 -
 108
108 -
 109
109 -
 110
110 -
 111
111 -
 112
112 -
 113
113 -
 114
114 -
 115
115 -
 116
116 -
 117
117 -
 118
118 -
 119
119 -
 120
120 -
 121
121 -
 122
122 -
 123
123 -
124
-
125
-
126
-
127
-
128
-
129
-
130
-
131
-
132
-
133
-
134
-
135
-
136
-
137
-
138
-
139
-
140
-
141
-
142
-
143
-
144
-
145
-
146
-
147
-
148
-
149
-
150
-
151
-
152
-
153
-
154
-
155
-
156
-
157
-
158
-
159
-
160
-
161
-
162
-
163
-
164
-
165
-
166
-
167
-
168
-
169
-
170
-
171
-
172
-
173
-
174
-
175
-
176
-
177
-
178
-
179
-
180
-
181
-
182
-
183
-
184
-
185
-
186
-
187
-
188
 |
 |

Annual Report
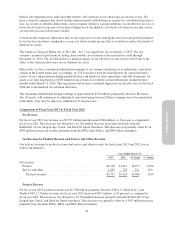
thereof, developments in tax audit and other matters, and variations in our annual pre-tax income or loss. We
incur certain tax expenses that do not decline proportionately with declines in our pre-tax consolidated income or
loss. As a result, in absolute dollar terms, our tax expense will have a greater influence on our effective tax rate at
lower levels of pre-tax income or loss than at higher levels. In addition, at lower levels of pre-tax income or loss,
our effective tax rate will be more volatile.
Certain taxable temporary differences that are not expected to reverse during the carry forward periods permitted
by tax law have not been considered as a source of future taxable income that is available to realize the benefit of
deferred tax assets.
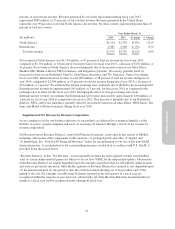
The American Taxpayer Relief Act of 2012 (the “Act”) was signed into law on January 2, 2013. The Act
contains a number of provisions including, most notably, an extension of the research tax credit through
December 31, 2013. The Act did not have a material impact on our effective tax rate for fiscal 2013 due to the
effect of the valuation allowance on our deferred tax assets.
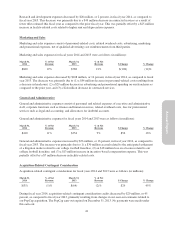
Historically, we have considered undistributed earnings of our foreign subsidiaries to be indefinitely reinvested
outside of the United States and, accordingly, no U.S. taxes have been provided thereon. In connection with a
review of our cash position including potential future cash needs for stock repurchases and debt retirement, we
made a one-time repatriation of $700 million from certain of our wholly-owned subsidiaries during the three
months ended March 31, 2014. This repatriation did not have a material impact on our effective tax rate for fiscal
2014 due to the deferred tax valuation allowance.
The remaining undistributed foreign earnings of approximately $150 million, principally related to Electronic
Arts (Canada), will continue to be indefinitely reinvested going forward. If these earnings were to be repatriated
in the future, they may be subject to additional U.S. income taxes.
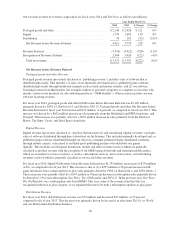
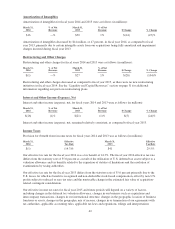
Comparison of Fiscal Year 2013 to Fiscal Year 2012
Net Revenue
For fiscal year 2013, net revenue was $3,797 million and decreased $346 million, or 8 percent, as compared to
fiscal year 2012. This decrease was driven by a $1,181 million decrease in revenue primarily from the
Battlefield, Crysis, Dragon Age, Portal, and Need for Speed franchises. This decrease was partially offset by an
$835 million increase in revenue primarily from the FIFA, Mass Effect, and FIFA Street franchises.
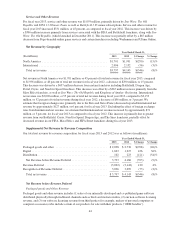
Net Revenue by Product Revenue and Service and Other Revenue
Our total net revenue by product revenue and service and other revenue for fiscal years 2013 and 2012 was as
follows (in millions):
Year Ended March 31,
2013 2012 $ Change % Change
Net revenue:
Product ................................................ $2,738 $3,415 $(677) (20)%
Service and other ........................................ 1,059 728 331 45%
Total net revenue ...................................... $3,797 $4,143 $(346) (8)%
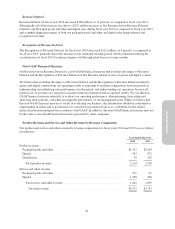
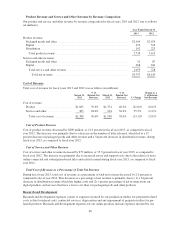
Product Revenue
For fiscal year 2013, product revenue was $2,738 million, primarily driven by FIFA 13, Battlefield 3, and
Madden NFL 13. Product revenue for fiscal year 2013 decreased $677 million, or 20 percent, as compared to
fiscal year 2012. This decrease was driven by a $1,224 million decrease primarily from the Battlefield, Crysis,
Dragon Age, Portal, and Need for Speed franchises. This decrease was partially offset by a $547 million increase
primarily from the Mass Effect, FIFA, and FIFA Street franchises.
43