BB&T 2007 Annual Report Download - page 104
Download and view the complete annual report
Please find page 104 of the 2007 BB&T annual report below. You can navigate through the pages in the report by either clicking on the pages listed below, or by using the keyword search tool below to find specific information within the annual report.-
 1
1 -
2
-
3
-
4
-
5
-
6
-
7
-
8
-
9
-
10
-
11
-
12
-
13
-
14
-
15
-
16
-
17
-
18
-
19
-
20
-
21
-
22
-
23
-
24
-
25
-
26
-
27
-
28
-
29
-
30
-
31
-
32
-
33
-
34
-
35
-
36
-
37
-
38
-
39
-
40
-
41
-
42
-
43
-
44
-
45
-
46
-
47
-
48
-
49
-
50
-
51
-
52
-
53
-
54
-
55
-
56
-
57
-
58
-
59
-
60
-
61
-
62
-
63
-
64
-
65
-
66
-
67
-
68
-
69
-
70
-
71
-
72
-
73
-
74
-
75
-
76
-
77
-
78
-
79
-
80
-
81
-
82
-
83
-
84
-
85
-
86
-
87
-
88
-
89
-
90
-
91
-
92
-
93
-
 94
94 -
 95
95 -
 96
96 -
 97
97 -
 98
98 -
 99
99 -
 100
100 -
 101
101 -
 102
102 -
 103
103 -
 104
104 -
 105
105 -
 106
106 -
 107
107 -
 108
108 -
 109
109 -
 110
110 -
 111
111 -
 112
112 -
 113
113 -
 114
114 -
115
-
116
-
117
-
118
-
119
-
120
-
121
-
122
-
123
-
124
-
125
-
126
-
127
-
128
-
129
-
130
-
131
-
132
-
133
-
134
-
135
-
136
-
137
 |
 |

BB&T CORPORATION AND SUBSIDIARIES
NOTES TO CONSOLIDATED FINANCIAL STATEMENTS—(Continued)
BB&T measures the fair value of restricted shares based on the price of BB&T’s common stock on the grant
date and the fair value of restricted share units based on the price of BB&T’s common stock on the grant date less
the present value of expected dividends that are foregone during the vesting period.
BB&T recorded $70 million and $58 million in equity-based compensation in 2007 and 2006, respectively. In
connection with this compensation expense, BB&T recorded an income tax benefit of $27 million and $22 million
in 2007 and 2006, respectively. The amount of equity-based compensation recorded in 2005 was not material. The
total intrinsic value of options exercised or restricted share units vested during 2007, 2006 and 2005 was $37
million, $46 million and $53 million, respectively. The total grant date fair value of equity-based awards that
vested during 2007 was $37 million. As of December 31, 2007, there was $109 million of unrecognized
compensation costs related to BB&T’s equity-based awards that is expected to be recognized over a weighted-
average life of 3.2 years.
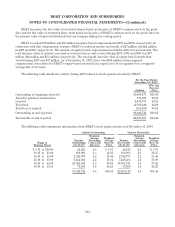
The following table details the activity during 2007 related to stock options awarded by BB&T:
For the Year Ended
December 31, 2007
Options
Wtd. Avg.
Exercise
Price
Outstanding at beginning of period 35,680,477 $35.30
Issued in purchase transactions 573,506 23.06
Granted 4,803,759 44.11
Exercised (2,396,440) 28.29
Forfeited or expired (618,560) 38.61
Outstanding at end of period 38,042,742 $36.61
Exercisable at end of period 22,893,116 $34.44
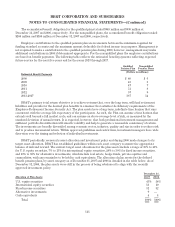
The following tables summarize information about BB&T’s stock option awards as of December 31, 2007:
Options Outstanding Options Exercisable
Range of
Exercise Prices
Number
Outstanding
12/31/07
Weighted-
Average
Remaining
Contractual
Life (yrs)
Weighted-
Average
Exercise
Price
Number
Exercisable
12/31/07
Weighted-
Average
Remaining
Contractual
Life (yrs)
Weighted-
Average
Exercise
Price
$ 8.11 to $10.00 22,213 2.8 $ 8.57 22,213 2.8 $ 8.57
10.01 to 15.00 160,903 2.3 12.35 160,903 2.3 12.35
15.01 to 25.00 2,342,797 2.2 23.44 2,342,797 2.2 23.44
25.01 to 35.00 6,454,818 4.2 31.84 5,526,483 4.1 31.69
35.01 to 45.00 28,982,502 6.5 38.86 14,761,211 5.2 37.42
45.01 to 53.10 79,509 1.4 49.21 79,509 1.4 49.21
38,042,742 5.8 $36.61 22,893,116 4.6 $34.44
104