BB&T 2007 Annual Report Download - page 117
Download and view the complete annual report
Please find page 117 of the 2007 BB&T annual report below. You can navigate through the pages in the report by either clicking on the pages listed below, or by using the keyword search tool below to find specific information within the annual report.-
 1
1 -
2
-
3
-
4
-
5
-
6
-
7
-
8
-
9
-
10
-
11
-
12
-
13
-
14
-
15
-
16
-
17
-
18
-
19
-
20
-
21
-
22
-
23
-
24
-
25
-
26
-
27
-
28
-
29
-
30
-
31
-
32
-
33
-
34
-
35
-
36
-
37
-
38
-
39
-
40
-
41
-
42
-
43
-
44
-
45
-
46
-
47
-
48
-
49
-
50
-
51
-
52
-
53
-
54
-
55
-
56
-
57
-
58
-
59
-
60
-
61
-
62
-
63
-
64
-
65
-
66
-
67
-
68
-
69
-
70
-
71
-
72
-
73
-
74
-
75
-
76
-
77
-
78
-
79
-
80
-
81
-
82
-
83
-
84
-
85
-
86
-
87
-
88
-
89
-
90
-
91
-
92
-
93
-
94
-
95
-
96
-
97
-
98
-
99
-
100
-
101
-
102
-
103
-
104
-
105
-
106
-
 107
107 -
 108
108 -
 109
109 -
 110
110 -
 111
111 -
 112
112 -
 113
113 -
 114
114 -
 115
115 -
 116
116 -
 117
117 -
 118
118 -
 119
119 -
 120
120 -
 121
121 -
 122
122 -
 123
123 -
 124
124 -
 125
125 -
 126
126 -
 127
127 -
128
-
129
-
130
-
131
-
132
-
133
-
134
-
135
-
136
-
137
 |
 |

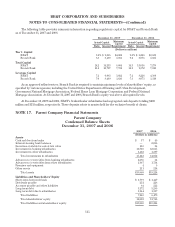
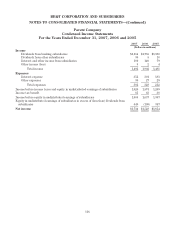
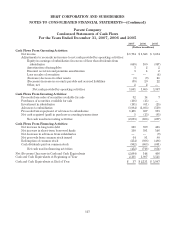
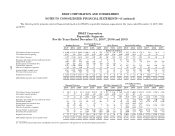
BB&T CORPORATION AND SUBSIDIARIES
NOTES TO CONSOLIDATED FINANCIAL STATEMENTS—(Continued)
Parent Company
Condensed Statements of Cash Flows
For the Years Ended December 31, 2007, 2006 and 2005
2007 2006 2005
(Dollars in millions)
Cash Flows From Operating Activities:
Net income $ 1,734 $ 1,528 $ 1,654
Adjustments to reconcile net income to net cash provided by operating activities:
Equity in earnings of subsidiaries (in excess of) less than dividends from
subsidiaries (649) 109 (347)
Amortization of intangibles 3 2 2
Discount accretion and premium amortization 3 4 2
Loss on sales of securities — — (4)
(Increase) decrease in other assets (3) (9) 28
(Decrease) increase in accounts payable and accrued liabilities (39) 29 22
Other, net 22—
Net cash provided by operating activities 1,051 1,665 1,357
Cash Flows From Investing Activities:
Proceeds from sales of securities available for sale 32 14 7
Purchases of securities available for sale (136) (15) —
Investment in subsidiaries (101) (61) (25)
Advances to subsidiaries (3,984) (1,033) (519)
Proceeds from repayment of advances to subsidiaries 1,491 307 393
Net cash acquired (paid) in purchase accounting transactions 5 (15) (93)
Net cash used in investing activities (2,693) (803) (237)
Cash Flows From Financing Activities:
Net increase in long-term debt 350 599 416
Net increase in short-term borrowed funds 350 391 146
Net decrease in advances from subsidiaries — — (9)
Net proceeds from common stock issued 64 91 80
Redemption of common stock (254) (936) (486)
Cash dividends paid on common stock (962) (863) (801)
Net cash used in financing activities (452) (718) (654)
Net (Decrease) Increase in Cash and Cash Equivalents (2,094) 144 466
Cash and Cash Equivalents at Beginning of Year 2,131 1,987 1,521
Cash and Cash Equivalents at End of Year $ 37 $ 2,131 $ 1,987
117