BB&T 2007 Annual Report Download - page 40
Download and view the complete annual report
Please find page 40 of the 2007 BB&T annual report below. You can navigate through the pages in the report by either clicking on the pages listed below, or by using the keyword search tool below to find specific information within the annual report.-
 1
1 -
2
-
3
-
4
-
5
-
6
-
7
-
8
-
9
-
10
-
11
-
12
-
13
-
14
-
15
-
16
-
17
-
18
-
19
-
20
-
21
-
22
-
23
-
24
-
25
-
26
-
27
-
28
-
29
-
 30
30 -
 31
31 -
 32
32 -
 33
33 -
 34
34 -
 35
35 -
 36
36 -
 37
37 -
 38
38 -
 39
39 -
 40
40 -
 41
41 -
 42
42 -
 43
43 -
 44
44 -
 45
45 -
 46
46 -
 47
47 -
 48
48 -
 49
49 -
 50
50 -
51
-
52
-
53
-
54
-
55
-
56
-
57
-
58
-
59
-
60
-
61
-
62
-
63
-
64
-
65
-
66
-
67
-
68
-
69
-
70
-
71
-
72
-
73
-
74
-
75
-
76
-
77
-
78
-
79
-
80
-
81
-
82
-
83
-
84
-
85
-
86
-
87
-
88
-
89
-
90
-
91
-
92
-
93
-
94
-
95
-
96
-
97
-
98
-
99
-
100
-
101
-
102
-
103
-
104
-
105
-
106
-
107
-
108
-
109
-
110
-
111
-
112
-
113
-
114
-
115
-
116
-
117
-
118
-
119
-
120
-
121
-
122
-
123
-
124
-
125
-
126
-
127
-
128
-
129
-
130
-
131
-
132
-
133
-
134
-
135
-
136
-
137
 |
 |

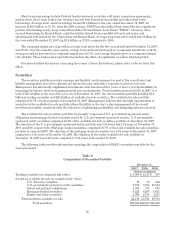
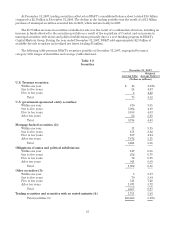
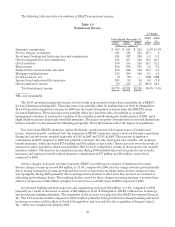
BB&T’s lending strategy, which focuses on relationship-based lending within our markets and smaller
individual loan balances, continues to produce credit quality that is better than its peer group of financial
institutions. As measured by relative levels of nonperforming assets and net charge-offs, BB&T’s asset quality
has remained significantly better than published industry averages.
The following table summarizes asset quality information for the past five years.
Table 11
Asset Quality
December 31,
2007 2006 2005 2004 2003
(Dollars in millions)
Nonaccrual loans and leases $ 502 $ 260 $ 229 $ 269 $ 350
Restructured loans ———— 1
Foreclosed property 194 89 71 89 96
Nonperforming assets $ 696 $ 349 $ 300 $ 358 $ 447
Loans 90 days or more past due and still accruing $ 223 $ 102 $ 103 $ 100 $ 117
Asset Quality Ratios: (1)
Nonaccrual and restructured loans and leases as a percentage of loans
and leases .55% .31% .31% .39% .56%
Nonperforming assets as a percentage of:
Total assets .52 .29 .27 .36 .49
Loans and leases plus foreclosed property .76 .42 .40 .52 .72
Net charge-offs as a percentage of average loans and leases .38 .27 .30 .36 .43
Allowance for loan and lease losses as a percentage of loans and leases 1.10 1.06 1.10 1.18 1.26
Allowance for loan and lease losses as a percentage of loans and leases
held for investment 1.10 1.07 1.11 1.19 1.27
Ratio of allowance for loan and leases to:
Net charge-offs 2.97x 4.12x 3.84x 3.42x 3.17x
Nonaccrual and restructured loans and leases 2.00 3.41 3.60 2.99 2.24
NOTE: (1) Items referring to loans and leases are net of unearned income and, except for loans and leases held
for investment, include loans held for sale.
During 2007, BB&T’s credit quality declined as a result of a very challenging economic environment.
Nonperforming assets and credit losses increased during the year, primarily in the latter half of 2007, as a result
of the slowing residential real estate market and a weaker overall economy. Nonperforming assets increased from
.29% of total assets at December 31, 2006 to .52% at year-end 2007. Net charge-offs for 2007 were .38% of average
loans and leases and reflected an increase of 11 basis points from the .27% level recorded during 2006. The
primary causes for the increase in net charge-offs were higher losses in residential real estate lending and higher
default rates at Regional Acceptance, BB&T’s sub-prime automobile lender. Management anticipates that net
charge-offs and nonperforming assets will continue to increase into 2008, but expects that the increases will be
manageable.
40