BB&T 2007 Annual Report Download - page 77
Download and view the complete annual report
Please find page 77 of the 2007 BB&T annual report below. You can navigate through the pages in the report by either clicking on the pages listed below, or by using the keyword search tool below to find specific information within the annual report.-
 1
1 -
2
-
3
-
4
-
5
-
6
-
7
-
8
-
9
-
10
-
11
-
12
-
13
-
14
-
15
-
16
-
17
-
18
-
19
-
20
-
21
-
22
-
23
-
24
-
25
-
26
-
27
-
28
-
29
-
30
-
31
-
32
-
33
-
34
-
35
-
36
-
37
-
38
-
39
-
40
-
41
-
42
-
43
-
44
-
45
-
46
-
47
-
48
-
49
-
50
-
51
-
52
-
53
-
54
-
55
-
56
-
57
-
58
-
59
-
60
-
61
-
62
-
63
-
64
-
65
-
66
-
 67
67 -
 68
68 -
 69
69 -
 70
70 -
 71
71 -
 72
72 -
 73
73 -
 74
74 -
 75
75 -
 76
76 -
 77
77 -
 78
78 -
 79
79 -
 80
80 -
 81
81 -
 82
82 -
 83
83 -
 84
84 -
 85
85 -
 86
86 -
 87
87 -
88
-
89
-
90
-
91
-
92
-
93
-
94
-
95
-
96
-
97
-
98
-
99
-
100
-
101
-
102
-
103
-
104
-
105
-
106
-
107
-
108
-
109
-
110
-
111
-
112
-
113
-
114
-
115
-
116
-
117
-
118
-
119
-
120
-
121
-
122
-
123
-
124
-
125
-
126
-
127
-
128
-
129
-
130
-
131
-
132
-
133
-
134
-
135
-
136
-
137
 |
 |

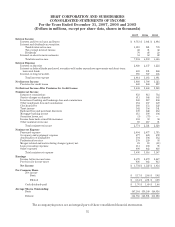
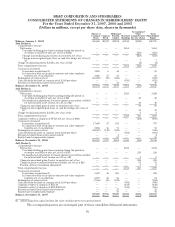
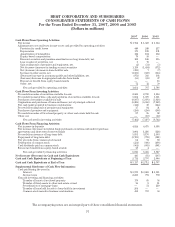
BB&T CORPORATION AND SUBSIDIARIES
CONSOLIDATED STATEMENTS OF CASH FLOWS
For the Years Ended December 31, 2007, 2006 and 2005
(Dollars in millions)
2007 2006 2005
Cash Flows From Operating Activities:
Net income $1,734 $ 1,528 $ 1,654
Adjustments to reconcile net income to net cash provided by operating activities:
Provision for credit losses 448 240 217
Depreciation 179 188 191
Amortization of intangibles 104 104 112
Equity-based compensation 70 58 —
Discount accretion and premium amortization on long-term debt, net 121 126 115
Loss on sales of securities, net 373—
Gain on disposals of premises and equipment, net (2) (31) (5)
Net decrease (increase) in trading account securities 1,138 (1,434) (372)
Net (increase) decrease in loans held for sale (383) 7 (7)
Increase in other assets, net (1,505) (539) (614)
(Decrease) increase in accounts payable and other liabilities, net (873) 503 305
(Increase) decrease in segregated cash due from banks (55) (68) 37
Excess tax benefit from equity-based awards — — 16
Other, net 72 12 59
Net cash provided by operating activities 1,051 767 1,708
Cash Flows From Investing Activities:
Proceeds from sales of securities available for sale 2,500 2,730 1,334
Proceeds from maturities, calls and paydowns of securities available for sale 5,604 1,670 3,311
Purchases of securities available for sale (8,987) (5,076) (5,818)
Originations and purchases of loans and leases, net of principal collected (6,286) (6,550) (7,348)
Net cash (paid) acquired in business combinations (141) 38 (124)
Proceeds from disposals of premises and equipment 17 84 31
Purchases of premises and equipment (256) (250) (198)
Proceeds from sales of foreclosed property or other real estate held for sale 87 85 82
Other, net — (18) (12)
Net cash used in investing activities (7,462) (7,287) (8,742)
Cash Flows From Financing Activities:
Net increase in deposits 4,824 4,475 6,588
Net increase (decrease) in federal funds purchased, securities sold under repurchase
agreements and short-term borrowed funds 1,004 1,286 (126)
Proceeds from issuance of long-term debt 5,831 3,176 2,593
Repayment of long-term debt (3,709) (798) (921)
Net proceeds from common stock issued 64 91 80
Redemption of common stock (254) (936) (486)
Cash dividends paid on common stock (962) (863) (801)
Excess tax benefit from equity-based awards 18 4 —
Net cash provided by financing activities 6,816 6,435 6,927
Net Increase (Decrease) in Cash and Cash Equivalents 405 (85) (107)
Cash and Cash Equivalents at Beginning of Year 2,712 2,797 2,904
Cash and Cash Equivalents at End of Year $ 3,117 $2,712 $2,797
Supplemental Disclosure of Cash Flow Information:
Cash paid during the year for:
Interest $3,978 $3,069 $1,911
Income taxes 2,233 791 780
Noncash investing and financing activities:
Transfer of loans to foreclosed property 179 85 58
Transfer of fixed assets to other real estate owned 16 8 11
Securitization of mortgage loans — 51 210
Transfer of loans held for sale to loans held for investment 264 — —
Common stock issued in business combinations 411 757 50
The accompanying notes are an integral part of these consolidated financial statements.
77