BB&T 2007 Annual Report Download - page 20
Download and view the complete annual report
Please find page 20 of the 2007 BB&T annual report below. You can navigate through the pages in the report by either clicking on the pages listed below, or by using the keyword search tool below to find specific information within the annual report.-
 1
1 -
2
-
3
-
4
-
5
-
6
-
7
-
8
-
9
-
 10
10 -
 11
11 -
 12
12 -
 13
13 -
 14
14 -
 15
15 -
 16
16 -
 17
17 -
 18
18 -
 19
19 -
 20
20 -
 21
21 -
 22
22 -
 23
23 -
 24
24 -
 25
25 -
 26
26 -
 27
27 -
 28
28 -
 29
29 -
 30
30 -
31
-
32
-
33
-
34
-
35
-
36
-
37
-
38
-
39
-
40
-
41
-
42
-
43
-
44
-
45
-
46
-
47
-
48
-
49
-
50
-
51
-
52
-
53
-
54
-
55
-
56
-
57
-
58
-
59
-
60
-
61
-
62
-
63
-
64
-
65
-
66
-
67
-
68
-
69
-
70
-
71
-
72
-
73
-
74
-
75
-
76
-
77
-
78
-
79
-
80
-
81
-
82
-
83
-
84
-
85
-
86
-
87
-
88
-
89
-
90
-
91
-
92
-
93
-
94
-
95
-
96
-
97
-
98
-
99
-
100
-
101
-
102
-
103
-
104
-
105
-
106
-
107
-
108
-
109
-
110
-
111
-
112
-
113
-
114
-
115
-
116
-
117
-
118
-
119
-
120
-
121
-
122
-
123
-
124
-
125
-
126
-
127
-
128
-
129
-
130
-
131
-
132
-
133
-
134
-
135
-
136
-
137
 |
 |

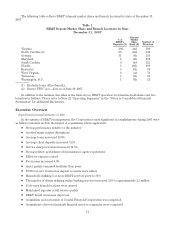
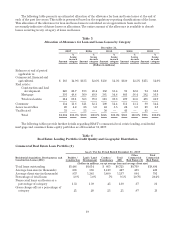
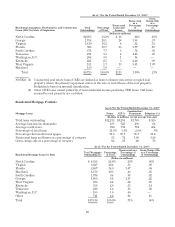
As of / For the Period Ended December 31, 2007
Residential Acquisition, Development, and Construction
Loans (ADC) by State of Origination Total
Outstandings Percentage
of Total
Nonaccrual
Loans and
Leases
Nonaccrual
as a
Percentage
of
Outstandings
Gross
Charge-Offs
as a
Percentage
of
Outstandings
(Dollars in millions)
North Carolina $2,893 33.2% $ 18 .62% .10%
Georgia 1,754 20.1 28 1.58 .57
Virginia 1,410 16.2 4 .32 .13
Florida 928 10.7 35 3.77 .10
South Carolina 674 7.7 5 .72 .02
Tennessee 291 3.3 4 1.25 .05
Washington, D.C. 264 3.0 1 .34 —
Kentucky 221 2.5 5 2.42 .09
West Virginia 151 1.7 13 8.61 1.07
Maryland 139 1.6 — — —
Total $8,725 100.0% $113 1.30% .21%
NOTES: (1) Commercial real estate loans (CRE) are defined as loans to finance non-owner occupied real
property where the primary repayment source is the sale or rental/lease of the real property.
Definition is based on internal classification.
(2) Other CRE loans consist primarily of non-residential income producing CRE loans. C&I loans
secured by real property are excluded.
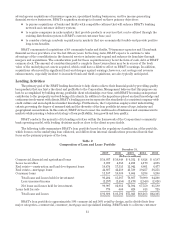
Residential Mortgage Portfolio
As of /For the Period Ended December 31, 2007
Mortgage Loans Prime ALT-A Construction/
Permanent Subprime (1)
(Dollars in millions, except average loan size)
Total loans outstanding $12,213 $3,295 $1,788 $ 520
Average loan size (in thousands) 187 323 298 64
Average credit score 720 734 734 604
Percentage of total loans 13.3% 3.6% 2.0% .6%
Percentage that are first mortgages 99.6 99.7 98.7 81.2
Nonaccrual loans and leases as a percentage of category .55 .72 1.09 3.28
Gross charge-offs as a percentage of category .04 .03 .26 .78
As of / For the Period Ended December 31, 2007
Residential Mortgage Loans by State Total Mortgages
Outstanding (1) Percentage
of Total
Nonaccrual as a
Percentage of
Outstandings
Gross Charge-Offs
as a Percentage
of Outstandings
(Dollars in millions)
North Carolina $ 4,385 24.6% .33% .06%
Virginia 3,627 20.4 .53 .09
Florida 2,657 14.9 1.67 .04
Maryland 1,876 10.5 .43 .05
South Carolina 1,676 9.4 .38 .02
Georgia 1,669 9.4 1.37 .22
West Virginia 398 2.2 .52 .01
Kentucky 356 2.0 .53 .14
Tennessee 246 1.4 .13 .02
Washington, D.C. 185 1.0 .40 —
Other 741 4.2 .94 .11
Total $17,816 100.0% .71% .08%
20