BB&T 2007 Annual Report Download - page 66
Download and view the complete annual report
Please find page 66 of the 2007 BB&T annual report below. You can navigate through the pages in the report by either clicking on the pages listed below, or by using the keyword search tool below to find specific information within the annual report.-
 1
1 -
2
-
3
-
4
-
5
-
6
-
7
-
8
-
9
-
10
-
11
-
12
-
13
-
14
-
15
-
16
-
17
-
18
-
19
-
20
-
21
-
22
-
23
-
24
-
25
-
26
-
27
-
28
-
29
-
30
-
31
-
32
-
33
-
34
-
35
-
36
-
37
-
38
-
39
-
40
-
41
-
42
-
43
-
44
-
45
-
46
-
47
-
48
-
49
-
50
-
51
-
52
-
53
-
54
-
55
-
 56
56 -
 57
57 -
 58
58 -
 59
59 -
 60
60 -
 61
61 -
 62
62 -
 63
63 -
 64
64 -
 65
65 -
 66
66 -
 67
67 -
 68
68 -
 69
69 -
 70
70 -
 71
71 -
 72
72 -
 73
73 -
 74
74 -
 75
75 -
 76
76 -
77
-
78
-
79
-
80
-
81
-
82
-
83
-
84
-
85
-
86
-
87
-
88
-
89
-
90
-
91
-
92
-
93
-
94
-
95
-
96
-
97
-
98
-
99
-
100
-
101
-
102
-
103
-
104
-
105
-
106
-
107
-
108
-
109
-
110
-
111
-
112
-
113
-
114
-
115
-
116
-
117
-
118
-
119
-
120
-
121
-
122
-
123
-
124
-
125
-
126
-
127
-
128
-
129
-
130
-
131
-
132
-
133
-
134
-
135
-
136
-
137
 |
 |
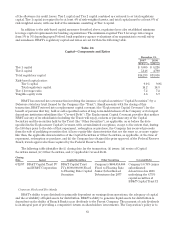
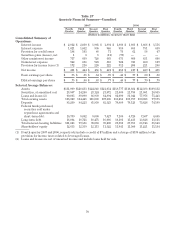
Noninterest income in the Banking Network increased $128 million, or 13.2%, during 2007, due primarily to
growth in overdraft fees, checkcard fees and other nondeposit fees and commissions. During 2006, noninterest
income increased $83 million, or 9.4%, due primarily to growth in other nondeposit fees and commissions.
Noninterest income allocated from other segments, which is reflected as intersegment net referral fees (“referral
fees”), increased $16 million, or 7.2%, compared to 2006, primarily due to higher referrals from the Financial
Services segment. Referral fees increased $8 million, or 3.7%, compared to 2005, primarily due to higher referral
fees earned from the Sales Finance and Financial Services segments, which was partially offset by a decrease in
referrals from the Residential Mortgage Banking segment. Noninterest expenses incurred within the Banking
Network during 2007 increased $71 million, or 5.1%, compared to 2006, including additional costs related to the
acquisition of Coastal. Comparing 2006 to 2005, noninterest expenses increased $122 million, or 9.5%, including
additional costs related to the acquisitions of Main Street and First Citizens and additional staffing in new
branches. Allocated corporate expenses increased $60 million, or 11.4%, in 2007 compared to 2006 after increasing
$98 million in 2006 compared to 2005 because of increased allocations of marketing and advertising expenses and
other corporate support areas.
The provision for income taxes allocated to the Banking Network increased $42 million in 2007 compared to
2006, primarily as a result of higher pretax income. Comparing 2006 to 2005 the provision for income taxes
increased $18 million, or 2.1%, primarily as a result of a higher effective tax rate in 2006 due to a change in the
methodology for allocating taxes to the segments. The increased tax rate was partially offset by lower pretax
income.
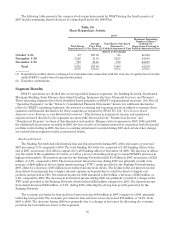
Total identifiable assets for the Banking Network increased $4.0 billion in 2007, or 7.1%, to a total of $60.7
billion, compared to an increase of $5.4 billion, or 10.4%, in 2006. The increase in 2007 included the acquisition of
Coastal, while the 2006 increase included the acquisitions of Main Street and First Citizens.
Residential Mortgage Banking
BB&T’s mortgage originations totaled $11.9 billion in 2007, up 20.7% from $9.9 billion in 2006. BB&T’s
residential mortgage servicing portfolio, which includes portfolio loans on BB&T’s balance sheet and loans
serviced for third parties, totaled $51.0 billion at year-end 2007 compared to $45.2 billion at December 31, 2006.
Net interest income for the Residential Mortgage Banking segment totaled $254 million in 2007, up 2.8%
compared to $247 million in 2006. The increase in net interest income in 2007 was primarily the result of growth in
the held for investment loan portfolio, offset by higher funding costs. Net interest income in 2006 was down
slightly compared to 2005 primarily as a result of a higher FTP charge in 2006.
The economic provision for loan and lease losses was unchanged during 2007 compared to 2006 and 2006
compared to 2005. The economic provision for loan and lease losses is based on expected losses and is therefore
more stable over time than the provision for loan and lease losses that is recorded in the Consolidated Statements
of Income.
Noninterest income in the Residential Mortgage Banking segment increased $11 million in 2007 compared to
2006, primarily reflecting higher gains from loan sales, while noninterest income in 2006 decreased $4 million, or
3.5%, compared to 2005 due to a substantial decrease in residential mortgage production revenues, which was
partially offset by an increase in residential mortgage servicing income. Noninterest expenses incurred within
the Residential Mortgage Banking segment increased $11 million, or 20.8%, during 2007, primarily reflecting
higher personnel costs. During 2006, noninterest expenses increased 3.9%, while allocated corporate expense
declined $25 million, or 69.4%, due to a change in the factors used to allocate expense to the segment.
The provision for income taxes allocated to the Residential Mortgage Banking segment in 2007 increased $3
million, primarily due to higher pretax income. Comparing 2006 to 2005, the provision for income taxes increased
$13 million, or 23.2%, primarily due to the change in methodology for allocating taxes to the segments.
Total identifiable assets for the Residential Mortgage Banking segment increased $2.1 billion, or 12.6%, from
2006 and $1.8 billion, or 12.0%, from 2006 to 2005, reflecting increases in mortgage loans due to higher originations
in 2007 and better loan retention due to slower prepayments in 2007 and 2006.
66