BB&T 2007 Annual Report Download - page 120
Download and view the complete annual report
Please find page 120 of the 2007 BB&T annual report below. You can navigate through the pages in the report by either clicking on the pages listed below, or by using the keyword search tool below to find specific information within the annual report.-
 1
1 -
2
-
3
-
4
-
5
-
6
-
7
-
8
-
9
-
10
-
11
-
12
-
13
-
14
-
15
-
16
-
17
-
18
-
19
-
20
-
21
-
22
-
23
-
24
-
25
-
26
-
27
-
28
-
29
-
30
-
31
-
32
-
33
-
34
-
35
-
36
-
37
-
38
-
39
-
40
-
41
-
42
-
43
-
44
-
45
-
46
-
47
-
48
-
49
-
50
-
51
-
52
-
53
-
54
-
55
-
56
-
57
-
58
-
59
-
60
-
61
-
62
-
63
-
64
-
65
-
66
-
67
-
68
-
69
-
70
-
71
-
72
-
73
-
74
-
75
-
76
-
77
-
78
-
79
-
80
-
81
-
82
-
83
-
84
-
85
-
86
-
87
-
88
-
89
-
90
-
91
-
92
-
93
-
94
-
95
-
96
-
97
-
98
-
99
-
100
-
101
-
102
-
103
-
104
-
105
-
106
-
107
-
108
-
109
-
 110
110 -
 111
111 -
 112
112 -
 113
113 -
 114
114 -
 115
115 -
 116
116 -
 117
117 -
 118
118 -
 119
119 -
 120
120 -
 121
121 -
 122
122 -
 123
123 -
 124
124 -
 125
125 -
 126
126 -
 127
127 -
 128
128 -
 129
129 -
 130
130 -
131
-
132
-
133
-
134
-
135
-
136
-
137
 |
 |

BB&T CORPORATION AND SUBSIDIARIES
NOTES TO CONSOLIDATED FINANCIAL STATEMENTS—(Continued)
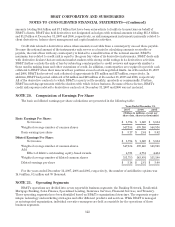
NOTE 19. Derivative Financial Instruments
The following tables set forth certain information concerning BB&T’s derivative financial instruments at
December 31, 2007 and 2006:
Derivative Financial Instruments
December 31, 2007 December 31, 2006
Notional
Amount
Estimated
Fair
Value Notional
Amount
Estimated
Fair
Value
(Dollars in millions)
Receive fixed swaps $12,564 $ 266 $ 6,594 $ (57)
Pay fixed swaps 6,393 (154) 3,899 4
Forward starting receive fixed swaps 2,326 70 1,285 5
Forward starting pay fixed swaps 1,099 (17) 544 —
Other swaps 5,457 (10) 264 (5)
Caps, floors, collars and other option trades 3,650 16 2,069 8
Foreign exchange contracts 227 — 258 —
Futures contracts 8,690 (3) 2,364 1
Treasury forwards 10 — — —
Interest rate lock commitments 1,203 2 546 (1)
Forward commitments 2,028 (10) 1,217 2
Swaptions 1,741 21 1,188 3
When-issued securities and forward rate agreements 1,703 — 2,613 (5)
Options on contracts purchased and sold 106 — 256 —
Total $47,197 $ 181 $23,097 $ (45)
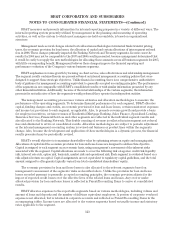
The following tables disclose data with respect to BB&T’s derivative financial instrument classifications and
hedging relationships:
Derivative Classifications and Hedging Relationships
December 31, 2007 December 31, 2006
Notional
Amount
Fair Value Notional
Amount
Fair Value
Gain Loss Gain Loss
(Dollars in millions)
Derivatives Designated as Cash Flow Hedges:
Hedging business loans $ 2,119 $ 20 $ — $ 2,119$8$(22)
Hedging institutional certificates of deposits and other time
deposits — — — 750 — —
Hedging short term funding 1,750 — (14) — — —
Hedging medium term bank notes and FHLB advances 2,934 — (8) 1,925 20 —
Derivatives Designated as Fair Value Hedges:
Hedging long-term debt 8,300 148 (6) 3,900 50 (97)
Hedging municipal securities 446 — (33) — — —
Derivatives Not Designated as Hedges 31,648 241 (167) 14,403 57 (61)
Total $47,197 $409 $(228) $23,097 $135 $(180)
120