BB&T 2007 Annual Report Download - page 48
Download and view the complete annual report
Please find page 48 of the 2007 BB&T annual report below. You can navigate through the pages in the report by either clicking on the pages listed below, or by using the keyword search tool below to find specific information within the annual report.-
 1
1 -
2
-
3
-
4
-
5
-
6
-
7
-
8
-
9
-
10
-
11
-
12
-
13
-
14
-
15
-
16
-
17
-
18
-
19
-
20
-
21
-
22
-
23
-
24
-
25
-
26
-
27
-
28
-
29
-
30
-
31
-
32
-
33
-
34
-
35
-
36
-
37
-
 38
38 -
 39
39 -
 40
40 -
 41
41 -
 42
42 -
 43
43 -
 44
44 -
 45
45 -
 46
46 -
 47
47 -
 48
48 -
 49
49 -
 50
50 -
 51
51 -
 52
52 -
 53
53 -
 54
54 -
 55
55 -
 56
56 -
 57
57 -
 58
58 -
59
-
60
-
61
-
62
-
63
-
64
-
65
-
66
-
67
-
68
-
69
-
70
-
71
-
72
-
73
-
74
-
75
-
76
-
77
-
78
-
79
-
80
-
81
-
82
-
83
-
84
-
85
-
86
-
87
-
88
-
89
-
90
-
91
-
92
-
93
-
94
-
95
-
96
-
97
-
98
-
99
-
100
-
101
-
102
-
103
-
104
-
105
-
106
-
107
-
108
-
109
-
110
-
111
-
112
-
113
-
114
-
115
-
116
-
117
-
118
-
119
-
120
-
121
-
122
-
123
-
124
-
125
-
126
-
127
-
128
-
129
-
130
-
131
-
132
-
133
-
134
-
135
-
136
-
137
 |
 |
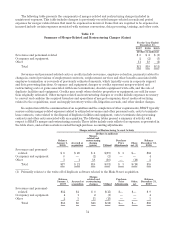
Provision for Credit Losses
A provision for credit losses is charged against earnings in order to maintain an allowance for loan and lease
losses and a reserve for unfunded lending commitments that reflects management’s best estimate of probable
losses inherent in the credit portfolios at the balance sheet date. The amount of the provision is based on
continuing assessments of nonperforming and “watch list” loans and associated unfunded credit commitments,
analytical reviews of loss experience in relation to outstanding loans and funded credit commitments, loan charge-
offs, nonperforming asset trends and management’s judgment with respect to current and expected economic
conditions and their impact on the loan portfolio and outstanding unfunded credit commitments.The
methodology used is described in the “Overview and Description of Business” section under the heading
“Allowance for Loan and Lease Losses and Reserve for Unfunded Credit Commitments.” The provision for credit
losses recorded by BB&T in 2007 was $448 million, compared with $240 million in 2006 and $217 million in 2005.
The provision for credit losses increased 86.7% during 2007 while the total loan and lease portfolio increased
9.7% compared to the balance outstanding at the end of 2006. Net charge-offs were .38% of average loans and
leases for 2007 compared to .27% of average loans and leases during 2006. The allowance for loan and lease losses
was 1.10% of loans and leases outstanding and was 2.00x total nonaccrual loans and leases at year-end 2007,
compared to 1.06% and 3.41x, respectively, at December 31, 2006. The increase in the provision for credit losses
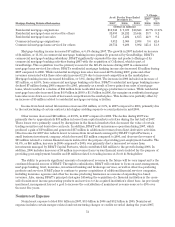
during 2007 compared to 2006 was largely driven by challenges in residential real estate markets with the largest
concentration of credit issues occurring in Atlanta, Georgia and Florida, as well as an increase in losses from
Regional Acceptance. While Florida represents a relatively large percentage of the nonaccrual loans in the
residential acquisition and development lending portfolio, the Florida residential acquisition and development
portfolio is only approximately 1% of BB&T’s total loans outstanding. Additional disclosures related to BB&T’s
real estate lending by product type and geographic distribution can be found in Table 6 herein. The 10.6%
increase in the provision for credit losses during 2006 compared to 2005 was primarily the result of growth in the
loan portfolio.
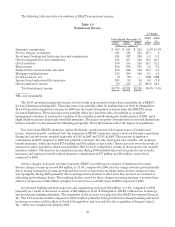
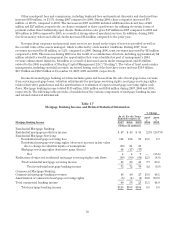
Noninterest Income
Noninterest income has become, and will continue to be, a significant contributor to BB&T’s financial
success. Noninterest income includes service charges on deposit accounts, trust revenue, mortgage banking
income, investment banking and brokerage fees and commissions, insurance commissions, gains and losses on
securities transactions and commissions and fees derived from other activities. Noninterest income as a
percentage of total revenues has steadily increased in recent years, totaling 41.3% for 2007. Exceeding 40% on
this measure has been a management objective for several years. Management has established a new goal for
noninterest income to exceed 45% of total revenues in the next five years to further reduce BB&T’s reliance on
traditional spread-based interest income, as fee-based activities are a relatively stable revenue source during
periods of changing interest rates.
48