BB&T 2007 Annual Report Download - page 116
Download and view the complete annual report
Please find page 116 of the 2007 BB&T annual report below. You can navigate through the pages in the report by either clicking on the pages listed below, or by using the keyword search tool below to find specific information within the annual report.-
 1
1 -
2
-
3
-
4
-
5
-
6
-
7
-
8
-
9
-
10
-
11
-
12
-
13
-
14
-
15
-
16
-
17
-
18
-
19
-
20
-
21
-
22
-
23
-
24
-
25
-
26
-
27
-
28
-
29
-
30
-
31
-
32
-
33
-
34
-
35
-
36
-
37
-
38
-
39
-
40
-
41
-
42
-
43
-
44
-
45
-
46
-
47
-
48
-
49
-
50
-
51
-
52
-
53
-
54
-
55
-
56
-
57
-
58
-
59
-
60
-
61
-
62
-
63
-
64
-
65
-
66
-
67
-
68
-
69
-
70
-
71
-
72
-
73
-
74
-
75
-
76
-
77
-
78
-
79
-
80
-
81
-
82
-
83
-
84
-
85
-
86
-
87
-
88
-
89
-
90
-
91
-
92
-
93
-
94
-
95
-
96
-
97
-
98
-
99
-
100
-
101
-
102
-
103
-
104
-
105
-
 106
106 -
 107
107 -
 108
108 -
 109
109 -
 110
110 -
 111
111 -
 112
112 -
 113
113 -
 114
114 -
 115
115 -
 116
116 -
 117
117 -
 118
118 -
 119
119 -
 120
120 -
 121
121 -
 122
122 -
 123
123 -
 124
124 -
 125
125 -
 126
126 -
127
-
128
-
129
-
130
-
131
-
132
-
133
-
134
-
135
-
136
-
137
 |
 |

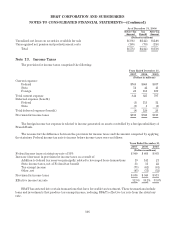
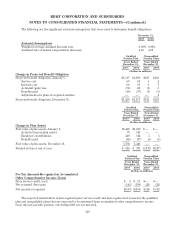
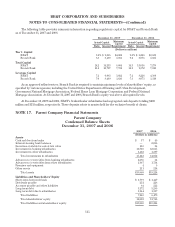
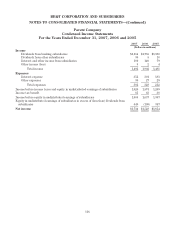
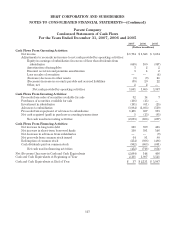
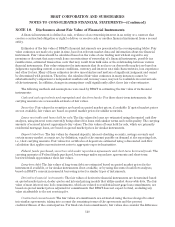
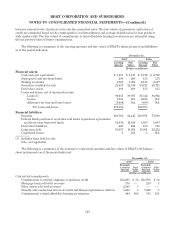
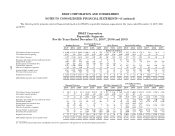
BB&T CORPORATION AND SUBSIDIARIES
NOTES TO CONSOLIDATED FINANCIAL STATEMENTS—(Continued)
Parent Company
Condensed Income Statements
For the Years Ended December 31, 2007, 2006 and 2005
2007 2006 2005
(Dollars in millions)
Income
Dividends from banking subsidiaries $1,184 $1,755 $1,380
Dividends from other subsidiaries 30 5 18
Interest and other income from subsidiaries 180 140 79
Other income (loss) 8 2 4
Total income 1,402 1,902 1,481
Expenses
Interest expense 352 301 183
Other expenses 30 27 29
Total expenses 382 328 212
Income before income taxes and equity in undistributed earnings of subsidiaries 1,020 1,574 1,269
Income tax benefit 65 63 38
Income before equity in undistributed earnings of subsidiaries 1,085 1,637 1,307
Equity in undistributed earnings of subsidiaries in excess of (less than) dividends from
subsidiaries 649 (109) 347
Net income $1,734 $1,528 $1,654
116