BB&T 2007 Annual Report Download - page 45
Download and view the complete annual report
Please find page 45 of the 2007 BB&T annual report below. You can navigate through the pages in the report by either clicking on the pages listed below, or by using the keyword search tool below to find specific information within the annual report.-
 1
1 -
2
-
3
-
4
-
5
-
6
-
7
-
8
-
9
-
10
-
11
-
12
-
13
-
14
-
15
-
16
-
17
-
18
-
19
-
20
-
21
-
22
-
23
-
24
-
25
-
26
-
27
-
28
-
29
-
30
-
31
-
32
-
33
-
34
-
 35
35 -
 36
36 -
 37
37 -
 38
38 -
 39
39 -
 40
40 -
 41
41 -
 42
42 -
 43
43 -
 44
44 -
 45
45 -
 46
46 -
 47
47 -
 48
48 -
 49
49 -
 50
50 -
 51
51 -
 52
52 -
 53
53 -
 54
54 -
 55
55 -
56
-
57
-
58
-
59
-
60
-
61
-
62
-
63
-
64
-
65
-
66
-
67
-
68
-
69
-
70
-
71
-
72
-
73
-
74
-
75
-
76
-
77
-
78
-
79
-
80
-
81
-
82
-
83
-
84
-
85
-
86
-
87
-
88
-
89
-
90
-
91
-
92
-
93
-
94
-
95
-
96
-
97
-
98
-
99
-
100
-
101
-
102
-
103
-
104
-
105
-
106
-
107
-
108
-
109
-
110
-
111
-
112
-
113
-
114
-
115
-
116
-
117
-
118
-
119
-
120
-
121
-
122
-
123
-
124
-
125
-
126
-
127
-
128
-
129
-
130
-
131
-
132
-
133
-
134
-
135
-
136
-
137
 |
 |
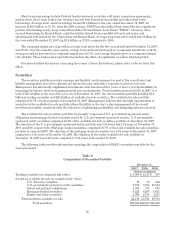
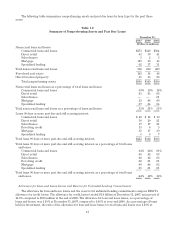
Shareholders’ Equity
Shareholders’ equity totaled $12.6 billion at December 31, 2007, an increase of $887 million, or 7.6%, from
year-end 2006. During 2007, BB&T issued 11.5 million shares in connection with business combinations, the
exercise of stock options and other equity-based incentive plans, which increased shareholders’ equity by $475
million. Additionally, growth of $748 million in shareholders’ equity resulted from BB&T’s earnings retained after
dividends to shareholders. This growth was partially offset by the repurchase of 7.0 million shares of common
stock at a cost of $254 million. In addition, BB&T recorded a reduction in retained earnings of $425 million in
connection with the adoption of FIN 48 and FSP FAS 13-2 and an increase to shareholders’ equity of $255 million
from other comprehensive income, which principally relates to an increase in the fair value of available-for-sale
securities.
Analysis of Results of Operations
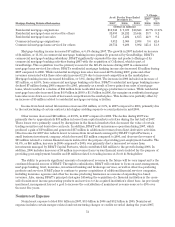
Consolidated net income for 2007 totaled $1.73 billion, which generated basic earnings per share of $3.17 and
diluted earnings per share of $3.14. Net income for 2006 was $1.53 billion and net income for 2005 totaled $1.65
billion. Basic earnings per share were $2.84 in 2006 and $3.02 in 2005, while diluted earnings per share were $2.81
and $3.00 for 2006 and 2005, respectively.
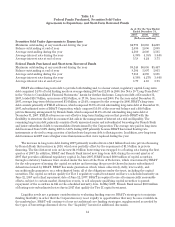
Two important and commonly used measures of bank profitability are return on average assets (net income
as a percentage of average total assets) and return on average shareholders’ equity (net income as a percentage
of average common shareholders’ equity). BB&T’s returns on average assets were 1.37%, 1.34%, and 1.58% for
the years ended December 31, 2007, 2006 and 2005, respectively. The returns on average common shareholders’
equity were 14.25%, 13.35%, and 14.95% for the last three years.
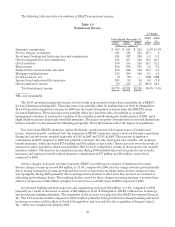
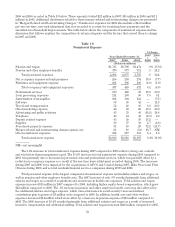
Net Interest Income
Net interest income is BB&T’s primary source of revenue. Net interest income is influenced by a number of
factors, including the volume, mix and maturity of interest-earning assets and interest-bearing liabilities and the
interest rates earned and paid thereon. The difference between rates earned on interest-earning assets and the
cost of the supporting funds (with an adjustment made to tax-exempt items to provide comparability with taxable
items, i.e. the “FTE” adjustment) is measured by the net interest margin. The accompanying table presents the
dollar amount of changes in interest income and interest expense, and distinguishes between the changes related
to increases or decreases in average outstanding balances of interest-earning assets and interest-bearing
liabilities (volume), and the changes related to increases or decreases in average interest rates on such assets and
liabilities (rate). Changes attributable to both volume and rate have been allocated proportionately.
For 2007, net interest income on an FTE-adjusted basis totaled $3.9 billion, compared with $3.8 billion in 2006
and $3.6 billion in 2005. Net interest income increased 5.2% in 2006 compared to 2005, as the benefit from strong
average earning asset growth of 9.6% was partially offset by the adverse impact from the steady increase in
short-term rates, which caused funding costs to increase at a faster pace than interest on earning assets. The 4.0%
increase in net interest income during 2007 resulted from similar factors, as earning assets grew 10.6%.
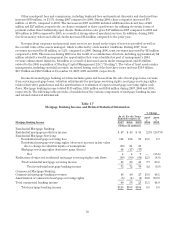
The FTE-adjusted net interest margin is the primary measure used in evaluating the gross profit margin
from the portfolios of earning assets. The FTE-adjusted net interest margin was 3.52% in 2007, 3.74% in 2006 and
3.89% in 2005. The average yield on interest earning assets increased 22 basis points compared to the average
yield during 2006, while the average cost of funds over the same time period increased 39 basis points. During the
second half of 2004 through the middle of 2006, the Federal Reserve Board implemented a series of interest rate
increases that ultimately increased short-term rates by 425 basis points. The Federal Reserve Board reversed
this trend in September 2007 and lowered short-term rates by 100 basis points in the last four months of 2007 and
an additional 125 basis points in January 2008. While many of BB&T’s liabilities reprice in a short period of time
after a change in rates, there is typically a delay of between three and eighteen months before BB&T’s assets will
be repriced. The decline in the net interest margin during 2007 compared to 2006 was affected by additional
funding costs associated with a payment to the IRS that was made in January 2007 as described in the “Provision
for Income Taxes” section below. In addition, the net interest margin continued to tighten in 2007 for three
primary reasons. First, the mix of asset growth has shifted from higher-yielding commercial real estate and
45