BB&T 2007 Annual Report Download - page 21
Download and view the complete annual report
Please find page 21 of the 2007 BB&T annual report below. You can navigate through the pages in the report by either clicking on the pages listed below, or by using the keyword search tool below to find specific information within the annual report.-
 1
1 -
2
-
3
-
4
-
5
-
6
-
7
-
8
-
9
-
10
-
 11
11 -
 12
12 -
 13
13 -
 14
14 -
 15
15 -
 16
16 -
 17
17 -
 18
18 -
 19
19 -
 20
20 -
 21
21 -
 22
22 -
 23
23 -
 24
24 -
 25
25 -
 26
26 -
 27
27 -
 28
28 -
 29
29 -
 30
30 -
 31
31 -
32
-
33
-
34
-
35
-
36
-
37
-
38
-
39
-
40
-
41
-
42
-
43
-
44
-
45
-
46
-
47
-
48
-
49
-
50
-
51
-
52
-
53
-
54
-
55
-
56
-
57
-
58
-
59
-
60
-
61
-
62
-
63
-
64
-
65
-
66
-
67
-
68
-
69
-
70
-
71
-
72
-
73
-
74
-
75
-
76
-
77
-
78
-
79
-
80
-
81
-
82
-
83
-
84
-
85
-
86
-
87
-
88
-
89
-
90
-
91
-
92
-
93
-
94
-
95
-
96
-
97
-
98
-
99
-
100
-
101
-
102
-
103
-
104
-
105
-
106
-
107
-
108
-
109
-
110
-
111
-
112
-
113
-
114
-
115
-
116
-
117
-
118
-
119
-
120
-
121
-
122
-
123
-
124
-
125
-
126
-
127
-
128
-
129
-
130
-
131
-
132
-
133
-
134
-
135
-
136
-
137
 |
 |

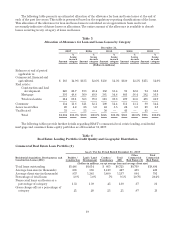
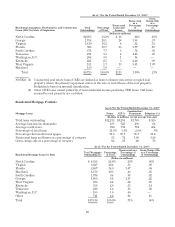
Home Equity Portfolio (2)
As of /For the Period Ended
December 31, 2007
Home Equity Loans & Lines Home Equity
Loans Home Equity
Lines
(Dollars in millions)
Total loans outstanding $10,138 $4,463
Average loan size (in thousands) (3) 47 32
Average credit score 724 757
Percentage of total loans 11.1% 4.9%
Percentage that are first mortgages 76.9 22.6
Nonaccrual loans and leases as a percentage of category .32 .19
Gross charge-offs as a percentage of category .29 .26
As of / For the Period Ended December 31, 2007
Home Equity Loans and Lines by State
Total Home Equity
Loans and Lines
Outstanding Percentage of Total
Nonaccrual as a
Percentage of
Outstanding
Gross Charge-Offs
as a Percentage
of Outstandings
(Dollars in millions)
North Carolina $ 5,145 35.2% .24% .43%
Virginia 3,223 22.1 .14 .19
South Carolina 1,454 10.0 .37 .23
Georgia 1,136 7.8 .41 .29
West Virginia 904 6.2 .30 .10
Maryland 843 5.8 .18 .15
Florida 714 4.9 .57 .27
Kentucky 615 4.2 .39 .20
Tennessee 457 3.1 .43 .08
Washington, D.C. 92 .6 .29 .55
Other 18 .1 .57 —
Total $14,601 100.0% .28% .28%
NOTES: (1) Includes $350 million in loans originated by Lendmark Financial Services, which are disclosed as a
part of the specialized lending category.
(2) Home Equity portfolio is a component of direct retail loans and originated through the BB&T
branching network.
(3) Home equity lines without an outstanding balance are excluded from this calculation.
Investment Activities
Investment securities represent a significant portion of BB&T’s assets. Branch Bank invests in securities as
allowable under bank regulations. These securities include obligations of the U.S. Treasury, U.S. government
agencies, U.S. government sponsored entities, including mortgage-backed securities, bank eligible obligations of
any state or political subdivision, privately-issued mortgage-backed securities, structured notes, bank eligible
corporate obligations, including corporate debentures, commercial paper, negotiable certificates of deposit,
bankers acceptances, mutual funds and limited types of equity securities. Branch Bank may also deal in securities
subject to the provisions of the Gramm-Leach-Bliley Act. Scott & Stringfellow, Inc., BB&T’s full-service
brokerage and investment banking subsidiary, engages in the underwriting, trading and sales of equity and debt
securities subject to the risk management policies of the Corporation.
BB&T’s investment activities are governed internally by a written, board-approved policy. The investment
policy is carried out by the Corporation’s Market Risk and Liquidity Committee (“MRLC”), which meets
regularly to review the economic environment and establish investment strategies. The MRLC also has much
broader responsibilities, which are discussed in the “Market Risk Management” section in “Management’s
Discussion and Analysis of Financial Condition and Results of Operations” herein.
Investment strategies are established by the MRLC based on the interest rate environment, balance sheet
mix, actual and anticipated loan demand, funding opportunities and the overall interest rate sensitivity of the
Corporation. In general, the investment portfolio is managed in a manner appropriate to the attainment of the
21