BB&T 2007 Annual Report Download - page 115
Download and view the complete annual report
Please find page 115 of the 2007 BB&T annual report below. You can navigate through the pages in the report by either clicking on the pages listed below, or by using the keyword search tool below to find specific information within the annual report.-
 1
1 -
2
-
3
-
4
-
5
-
6
-
7
-
8
-
9
-
10
-
11
-
12
-
13
-
14
-
15
-
16
-
17
-
18
-
19
-
20
-
21
-
22
-
23
-
24
-
25
-
26
-
27
-
28
-
29
-
30
-
31
-
32
-
33
-
34
-
35
-
36
-
37
-
38
-
39
-
40
-
41
-
42
-
43
-
44
-
45
-
46
-
47
-
48
-
49
-
50
-
51
-
52
-
53
-
54
-
55
-
56
-
57
-
58
-
59
-
60
-
61
-
62
-
63
-
64
-
65
-
66
-
67
-
68
-
69
-
70
-
71
-
72
-
73
-
74
-
75
-
76
-
77
-
78
-
79
-
80
-
81
-
82
-
83
-
84
-
85
-
86
-
87
-
88
-
89
-
90
-
91
-
92
-
93
-
94
-
95
-
96
-
97
-
98
-
99
-
100
-
101
-
102
-
103
-
104
-
 105
105 -
 106
106 -
 107
107 -
 108
108 -
 109
109 -
 110
110 -
 111
111 -
 112
112 -
 113
113 -
 114
114 -
 115
115 -
 116
116 -
 117
117 -
 118
118 -
 119
119 -
 120
120 -
 121
121 -
 122
122 -
 123
123 -
 124
124 -
 125
125 -
126
-
127
-
128
-
129
-
130
-
131
-
132
-
133
-
134
-
135
-
136
-
137
 |
 |

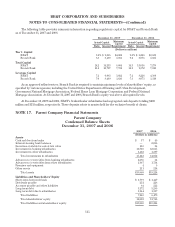
BB&T CORPORATION AND SUBSIDIARIES
NOTES TO CONSOLIDATED FINANCIAL STATEMENTS—(Continued)
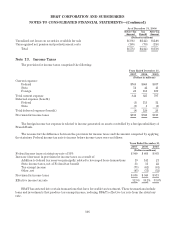
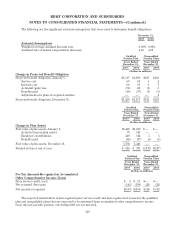
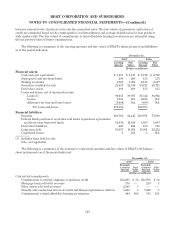
The following table provides summary information regarding regulatory capital for BB&T and Branch Bank
as of December 31, 2007 and 2006:
December 31, 2007 December 31, 2006
Actual Capital Minimum
Capital
Requirement
Actual Capital Minimum
Capital
RequirementRatio Amount Ratio Amount
(Dollars in millions)
Tier 1 Capital
BB&T 9.1% $ 9,085 $4,002 9.0% $ 8,226 $3,639
Branch Bank 8.8 8,469 3,866 9.2 8,075 3,505
Total Capital
BB&T 14.2 14,233 8,004 14.3 13,016 7,279
Branch Bank 11.1 10,707 7,732 11.3 9,872 7,010
Leverage Capital
BB&T 7.2 9,085 5,021 7.2 8,226 4,560
Branch Bank 7.0 8,469 3,636 7.3 8,075 3,310
As an approved seller/servicer, Branch Bank is required to maintain minimum levels of shareholders’ equity, as
specified by various agencies, including the United States Department of Housing and Urban Development,
Government National Mortgage Association, Federal Home Loan Mortgage Corporation and Federal National
Mortgage Association. At December 31, 2007 and 2006, Branch Bank’s equity was above all required levels.
At December 31, 2007 and 2006, BB&T’s broker/dealer subsidiaries had segregated cash deposits totaling $208
million and $153 million, respectively. These deposits relate to monies held for the exclusive benefit of clients.
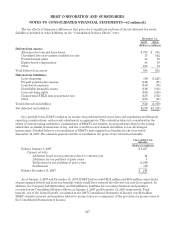
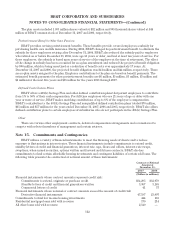
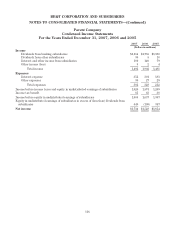
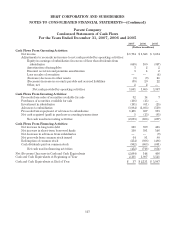
NOTE 17. Parent Company Financial Statements
Parent Company
Condensed Balance Sheets
December 31, 2007 and 2006
2007 2006
(Dollars in millions)
Assets
Cash and due from banks $37 $45
Interest-bearing bank balances — 2,086
Securities available for sale at fair value 133 34
Investment in banking subsidiaries 13,710 12,655
Investment in other subsidiaries 1,432 1,397
Total investments in subsidiaries 15,142 14,052
Advances to / receivables from banking subsidiaries 2,386 54
Advances to / receivables from other subsidiaries 1,967 1,734
Premises and equipment 45
Other assets 211 214
Total assets $19,880 $18,224
Liabilities and Shareholders’ Equity
Short-term borrowed funds $ 1,797 $ 1,447
Dividends payable 251 228
Accounts payable and other liabilities 84 212
Long-term debt 3,172 3,285
Long-term debt due to subsidiaries 1,944 1,307
Total liabilities 7,248 6,479
Total shareholders’ equity 12,632 11,745
Total liabilities and shareholders’ equity $19,880 $18,224
115