BB&T 2007 Annual Report Download - page 89
Download and view the complete annual report
Please find page 89 of the 2007 BB&T annual report below. You can navigate through the pages in the report by either clicking on the pages listed below, or by using the keyword search tool below to find specific information within the annual report.-
 1
1 -
2
-
3
-
4
-
5
-
6
-
7
-
8
-
9
-
10
-
11
-
12
-
13
-
14
-
15
-
16
-
17
-
18
-
19
-
20
-
21
-
22
-
23
-
24
-
25
-
26
-
27
-
28
-
29
-
30
-
31
-
32
-
33
-
34
-
35
-
36
-
37
-
38
-
39
-
40
-
41
-
42
-
43
-
44
-
45
-
46
-
47
-
48
-
49
-
50
-
51
-
52
-
53
-
54
-
55
-
56
-
57
-
58
-
59
-
60
-
61
-
62
-
63
-
64
-
65
-
66
-
67
-
68
-
69
-
70
-
71
-
72
-
73
-
74
-
75
-
76
-
77
-
78
-
 79
79 -
 80
80 -
 81
81 -
 82
82 -
 83
83 -
 84
84 -
 85
85 -
 86
86 -
 87
87 -
 88
88 -
 89
89 -
 90
90 -
 91
91 -
 92
92 -
 93
93 -
 94
94 -
 95
95 -
 96
96 -
 97
97 -
 98
98 -
 99
99 -
100
-
101
-
102
-
103
-
104
-
105
-
106
-
107
-
108
-
109
-
110
-
111
-
112
-
113
-
114
-
115
-
116
-
117
-
118
-
119
-
120
-
121
-
122
-
123
-
124
-
125
-
126
-
127
-
128
-
129
-
130
-
131
-
132
-
133
-
134
-
135
-
136
-
137
 |
 |

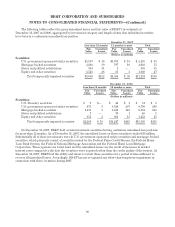
BB&T CORPORATION AND SUBSIDIARIES
NOTES TO CONSOLIDATED FINANCIAL STATEMENTS—(Continued)
December 31, 2006
Amortized
Cost
Gross Unrealized Fair
ValueGains Losses
(Dollars in millions)
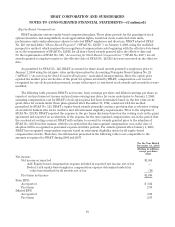
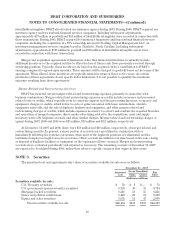
Securities available for sale:
U.S. Treasury securities $ 84 $— $ 1 $ 83
U.S. government-sponsored entity securities 9,324 2 290 9,036
Mortgage-backed securities 8,418 27 148 8,297
States and political subdivisions 563 9 1 571
Equity and other securities 2,723 26 15 2,734
Total securities available for sale $21,112 $ 64 $455 $20,721
Accumulated other comprehensive income at December 31, 2007 and 2006 included $28 million and $249
million, respectively, of net after-tax unrealized losses relating to securities available for sale.
At December 31, 2007 and 2006, securities with carrying value of approximately $13.9 billion and $12.6 billion
were pledged to secure municipal deposits, securities sold under agreements to repurchase, other borrowings,
and for other purposes as required or permitted by law.
BB&T had certain investments in marketable debt securities and mortgage-backed securities issued by
Fannie Mae and Freddie Mac that exceeded ten percent of shareholders’ equity at December 31, 2007. Those
investments each had total amortized cost and market values of $4.3 billion and $4.3 billion, respectively, at
December 31, 2007. Trading securities totaling $1.0 billion at December 31, 2007 and $2.1 billion at December 31,
2006 are excluded from the accompanying tables.
Equity securities include investments in stock issued by the FHLB of Atlanta. At December 31, 2007 and
2006, BB&T held $365 million and $379 million, respectively, of investments in FHLB stock.
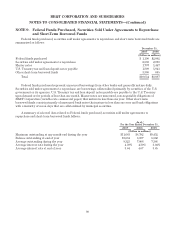
Proceeds from sales of securities available for sale during 2007, 2006 and 2005 were $2.5 billion, $2.7 billion
and $1.3 billion, respectively. Gross gains of $22 million, $2 million and $13 million and gross losses of $25 million,
$75 million and $13 million were realized on those sales in 2007, 2006 and 2005, respectively.
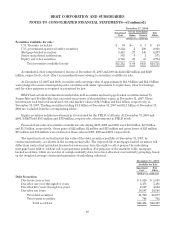
The amortized cost and estimated fair value of the debt securities portfolio at December 31, 2007, by
contractual maturity, are shown in the accompanying table. The expected life of mortgage-backed securities will
differ from contractual maturities because borrowers may have the right to call or prepay the underlying
mortgage loans with or without call or prepayment penalties. For purposes of the maturity table, mortgage-
backed securities, which are not due at a single maturity date, have been allocated over maturity groupings based
on the weighted average contractual maturities of underlying collateral.
December 31, 2007
Available for Sale
Amortized
Cost Fair
Value
(Dollars in millions)
Debt Securities:
Due in one year or less $ 1,020 $ 1,018
Due after one year through five years 5,476 5,481
Due after five years through ten years 4,627 4,632
Due after ten years 10,597 10,546
Total debt securities 21,720 21,677
Total equity securities 744 742
Total securities $22,464 $22,419
89