BB&T 2007 Annual Report Download - page 50
Download and view the complete annual report
Please find page 50 of the 2007 BB&T annual report below. You can navigate through the pages in the report by either clicking on the pages listed below, or by using the keyword search tool below to find specific information within the annual report.-
 1
1 -
2
-
3
-
4
-
5
-
6
-
7
-
8
-
9
-
10
-
11
-
12
-
13
-
14
-
15
-
16
-
17
-
18
-
19
-
20
-
21
-
22
-
23
-
24
-
25
-
26
-
27
-
28
-
29
-
30
-
31
-
32
-
33
-
34
-
35
-
36
-
37
-
38
-
39
-
 40
40 -
 41
41 -
 42
42 -
 43
43 -
 44
44 -
 45
45 -
 46
46 -
 47
47 -
 48
48 -
 49
49 -
 50
50 -
 51
51 -
 52
52 -
 53
53 -
 54
54 -
 55
55 -
 56
56 -
 57
57 -
 58
58 -
 59
59 -
 60
60 -
61
-
62
-
63
-
64
-
65
-
66
-
67
-
68
-
69
-
70
-
71
-
72
-
73
-
74
-
75
-
76
-
77
-
78
-
79
-
80
-
81
-
82
-
83
-
84
-
85
-
86
-
87
-
88
-
89
-
90
-
91
-
92
-
93
-
94
-
95
-
96
-
97
-
98
-
99
-
100
-
101
-
102
-
103
-
104
-
105
-
106
-
107
-
108
-
109
-
110
-
111
-
112
-
113
-
114
-
115
-
116
-
117
-
118
-
119
-
120
-
121
-
122
-
123
-
124
-
125
-
126
-
127
-
128
-
129
-
130
-
131
-
132
-
133
-
134
-
135
-
136
-
137
 |
 |

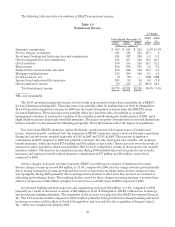
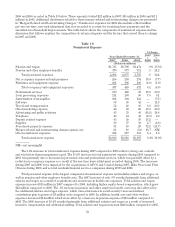
Other nondeposit fees and commissions, including bankcard fees and merchant discounts and checkcard fees
increased $59 million, or 13.3%, during 2007 compared to 2006. During 2006, these categories increased $75
million, or 20.3%, compared to 2005. The increases in 2007 and 2006 included additional checkcard fees of $25
million and $27 million, respectively, as clients continued to show a preference for utilizing electronic forms of
payment rather than traditional paper checks. Bankcard fees also grew $17 million in 2007 compared to 2006 and
$10 million in 2006 compared to 2005, as a result of strong sales of merchant services. In addition, during 2006,
fees from money orders and official checks increased $14 million compared to the prior year.
Revenue from corporate and personal trust services are based on the types of services provided as well as
the overall value of the assets managed, which is affected by stock market conditions. During 2007, trust
revenues increased by $8 million, or 5.2%, compared to 2006. During 2006, trust revenues increased by $13 million
compared to 2005. The increase during 2006 was the result of a combination of factors, including approximately $4
million related to wealth management fee opportunities that were identified as part of management’s 2004
revenue enhancement initiative, $4 million as a result of increased assets under management and $3 million
related to the 2005 acquisition of Sterling Capital Management LLC (“Sterling”). The value of trust assets under
management, including custodial accounts, increased during each of the last three years and was $36.9 billion,
$33.7 billion and $32.9 billion at December 31, 2007, 2006 and 2005, respectively.
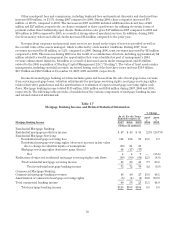
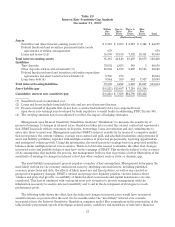
Income from mortgage banking activities includes gains and losses from the sale of mortgage loans, revenue
from servicing mortgage loans, valuation adjustments for mortgage servicing rights, mortgage servicing rights-
related derivative gains/losses and the amortization or realization of expected mortgage servicing rights cash
flows. Mortgage banking income totaled $115 million, $108 million and $104 million during 2007, 2006 and 2005,
respectively. The following table provides a breakdown of the various components of mortgage banking income
and related statistical information:
Table 17
Mortgage Banking Income and Related Statistical Information
% Change
As of/ For the Years
Ended December 31, 2007
v.
2006
2006
v.
2005Mortgage Banking Income 2007 2006 2005
(Dollars in millions)
Residential Mortgage Banking:
Residential mortgage production income $ 47 $ 46 $ 58 2.2% (20.7)%
Residential Mortgage Servicing:
Residential mortgage servicing fees 114 102 96 11.8 6.3
Residential mortgage servicing rights (decrease) increase in fair value
due to change in valuation inputs or assumptions (60) 21 86
Mortgage servicing rights derivative gains (losses) 64 (17) (77)
Net 4 4 9 — (55.6)
Realization of expected residential mortgage servicing rights cash flows (90) (80) (84) 12.5 (4.8)
Total residential mortgage servicing income 28 26 21 7.7 23.8
Total residential mortgage banking income 75 72 79 4.2 (8.9)
Commercial Mortgage Banking:
Commercial mortgage banking revenues 46 40 27 15.0 48.1
Amortization of commercial mortgage servicing rights (6) (4) (2) 50.0 100.0
Total commercial banking income 40 36 25 11.1 44.0
Total mortgage banking income $115 $108 $104 6.5 3.8
50