BB&T 2007 Annual Report Download - page 52
Download and view the complete annual report
Please find page 52 of the 2007 BB&T annual report below. You can navigate through the pages in the report by either clicking on the pages listed below, or by using the keyword search tool below to find specific information within the annual report.-
 1
1 -
2
-
3
-
4
-
5
-
6
-
7
-
8
-
9
-
10
-
11
-
12
-
13
-
14
-
15
-
16
-
17
-
18
-
19
-
20
-
21
-
22
-
23
-
24
-
25
-
26
-
27
-
28
-
29
-
30
-
31
-
32
-
33
-
34
-
35
-
36
-
37
-
38
-
39
-
40
-
41
-
 42
42 -
 43
43 -
 44
44 -
 45
45 -
 46
46 -
 47
47 -
 48
48 -
 49
49 -
 50
50 -
 51
51 -
 52
52 -
 53
53 -
 54
54 -
 55
55 -
 56
56 -
 57
57 -
 58
58 -
 59
59 -
 60
60 -
 61
61 -
 62
62 -
63
-
64
-
65
-
66
-
67
-
68
-
69
-
70
-
71
-
72
-
73
-
74
-
75
-
76
-
77
-
78
-
79
-
80
-
81
-
82
-
83
-
84
-
85
-
86
-
87
-
88
-
89
-
90
-
91
-
92
-
93
-
94
-
95
-
96
-
97
-
98
-
99
-
100
-
101
-
102
-
103
-
104
-
105
-
106
-
107
-
108
-
109
-
110
-
111
-
112
-
113
-
114
-
115
-
116
-
117
-
118
-
119
-
120
-
121
-
122
-
123
-
124
-
125
-
126
-
127
-
128
-
129
-
130
-
131
-
132
-
133
-
134
-
135
-
136
-
137
 |
 |

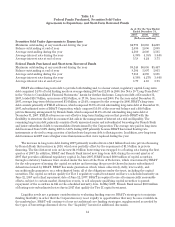
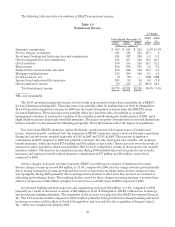
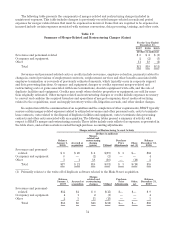
2006 and 2005 as noted in Table 18 below. These amounts totaled $21 million in 2007, $18 million in 2006 and $(11
million) in 2005. Additional disclosures related to these merger-related and restructuring charges are presented
in “Merger-Related and Restructuring Charges.” Noninterest expenses for 2005 also include a $44.0 million
pre-tax one-time, non-cash adjustment that was recorded to account for escalating lease payments and the
amortization of leasehold improvements. The table below shows the components of noninterest expense and the
discussion that follows explains the composition of certain categories and the factors that caused them to change
in 2007 and 2006.
Table 18
Noninterest Expense
% Change
Years Ended December 31, 2007
v.
2006
2006
v.
20052007 2006 2005
(Dollars in millions)
Salaries and wages $1,715 $1,700 $1,474 .9% 15.3%
Pension and other employee benefits 379 377 311 .5 21.2
Total personnel expenses 2,094 2,077 1,785 .8 16.4
Net occupancy expense on bank premises 286 253 274 13.0 (7.7)
Furniture and equipment expense 191 196 198 (2.6) (1.0)
Total occupancy and equipment expenses 477 449 472 6.2 (4.9)
Professional services 139 120 93 15.8 29.0
Loan processing expenses 111 103 98 7.8 5.1
Amortization of intangibles 104 104 112 — (7.1)
Software 58 58 52 — 11.5
Travel and transportation 52 48 38 8.3 26.3
Other marketing expense 46 30 25 53.3 20.0
Advertising and public relations 45 55 48 (18.2) 14.6
Telephone 43 44 43 (2.3) 2.3
Deposit related expense 43 38 38 13.2 —
Supplies 38 37 38 2.7 (2.6)
Foreclosed property expense 31 18 23 72.2 (21.7)
Merger-related and restructuring charges (gains), net 21 18 (11) 16.7 NM
Other noninterest expenses 334 317 313 5.4 1.3
Total noninterest expense $3,636 $3,516 $3,167 3.4% 11.0%
NM—not meaningful
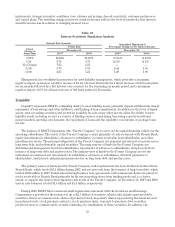
The 3.4% increase in total noninterest expense during 2007 compared to 2006 reflects strong cost controls
and was better than management’s goal. The 11.0% increase in total noninterest expense during 2006 compared to
2005 was primarily due to increases in personnel costs and professional services, which was partially offset by a
reduction in occupancy expense as a result of the one-time lease adjustment recorded during 2005. The increases
during 2007 and 2006 were impacted by the acquisitions of AFCO and Coastal during 2007, Main Street and First
Citizens during 2006, and several nonbank financial services companies during 2007 and 2006.
Total personnel expense is the largest component of noninterest expense and includes salaries and wages, as
well as pension and other employee benefit costs. The 2007 increase of only .8% resulted primarily from additional
salaries and wages as a result of acquisitions and an increase in health care expenses. Total salaries and wages
expense increased $15 million in 2007 compared to 2006, including higher equity-based compensation, which grew
$12 million compared to 2006. The .5% increase in pension and other employee benefit costs was also affected by
the additional salaries and wages expense, which caused increases in social security taxes and defined
contribution plan expenses of $5 million each compared to 2006. In addition, health care and other welfare
expenses increased $14 million which were offset by a decrease in pension expense of $18 million compared to
2006. The 2006 increase of 16.4% resulted primarily from additional salaries and wages as a result of increased
incentive compensation and additional staffing. Total salaries and wages increased $226 million compared to 2005,
52