BB&T 2007 Annual Report Download - page 111
Download and view the complete annual report
Please find page 111 of the 2007 BB&T annual report below. You can navigate through the pages in the report by either clicking on the pages listed below, or by using the keyword search tool below to find specific information within the annual report.-
 1
1 -
2
-
3
-
4
-
5
-
6
-
7
-
8
-
9
-
10
-
11
-
12
-
13
-
14
-
15
-
16
-
17
-
18
-
19
-
20
-
21
-
22
-
23
-
24
-
25
-
26
-
27
-
28
-
29
-
30
-
31
-
32
-
33
-
34
-
35
-
36
-
37
-
38
-
39
-
40
-
41
-
42
-
43
-
44
-
45
-
46
-
47
-
48
-
49
-
50
-
51
-
52
-
53
-
54
-
55
-
56
-
57
-
58
-
59
-
60
-
61
-
62
-
63
-
64
-
65
-
66
-
67
-
68
-
69
-
70
-
71
-
72
-
73
-
74
-
75
-
76
-
77
-
78
-
79
-
80
-
81
-
82
-
83
-
84
-
85
-
86
-
87
-
88
-
89
-
90
-
91
-
92
-
93
-
94
-
95
-
96
-
97
-
98
-
99
-
100
-
 101
101 -
 102
102 -
 103
103 -
 104
104 -
 105
105 -
 106
106 -
 107
107 -
 108
108 -
 109
109 -
 110
110 -
 111
111 -
 112
112 -
 113
113 -
 114
114 -
 115
115 -
 116
116 -
 117
117 -
 118
118 -
 119
119 -
 120
120 -
 121
121 -
122
-
123
-
124
-
125
-
126
-
127
-
128
-
129
-
130
-
131
-
132
-
133
-
134
-
135
-
136
-
137
 |
 |

BB&T CORPORATION AND SUBSIDIARIES
NOTES TO CONSOLIDATED FINANCIAL STATEMENTS—(Continued)
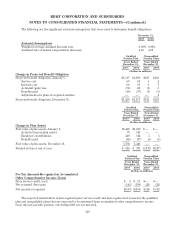
The accumulated benefit obligation for the qualified plans totaled $948 million and $930 million at
December 31, 2007 and 2006, respectively. For the nonqualified plans, the accumulated benefit obligation totaled
$106 million and $100 million at December 31, 2007 and 2006, respectively.
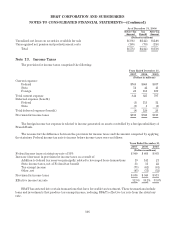
Employer contributions to the qualified pension plan are in amounts between the minimum required for
funding standard accounts and the maximum amount deductible for federal income tax purposes. Management is
not required to make a contribution to the qualified pension plan during 2008; however, management may make
additional contributions in 2008 if determined appropriate. For the nonqualified plans the employer contributions
are based on benefit payments. The following table reflects the estimated benefit payments reflecting expected
future service for the next five years and for the years 2013 through 2017.
Qualified
Pension Plan Nonqualified
Pension Plans
(Dollars in millions)
Estimated Benefit Payments
2008 $40 $6
2009 43 6
2010 47 7
2011 51 8
2012 57 9
2013-2017 387 54
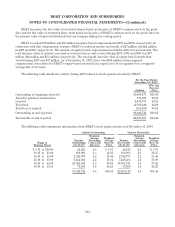
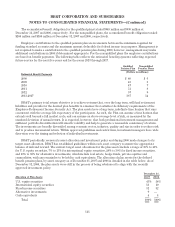
BB&T’s primary total return objective is to achieve returns that, over the long term, will fund retirement
liabilities and provide for the desired plan benefits in a manner that satisfies the fiduciary requirements of the
Employee Retirement Income Security Act. The plan assets have a long-term, indefinite time horizon that runs
concurrent with the average life expectancy of the participants. As such, the Plan can assume a time horizon that
extends well beyond a full market cycle, and can assume an above-average level of risk, as measured by the
standard deviation of annual return. It is expected, however, that both professional investment management and
sufficient portfolio diversification will smooth volatility and help to generate a reasonable consistency of return.
The investments are broadly diversified among economic sector, industry, quality and size in order to reduce risk
and to produce incremental return. Within approved guidelines and restrictions, investment managers have wide
discretion over the timing and selection of individual investments.
BB&T periodically reviews its asset allocation and investment policy and during 2006 made changes to its
target asset allocation. BB&T has established guidelines within each asset category to ensure the appropriate
balance of risk and reward. The current target asset allocations for the plan assets include a range of 35% to 45%
for U.S. equity securities, 7% to 13% for international equity securities, 20% to 30% for fixed income securities,
and 10% to 30% for alternative investments, which include real estate, hedge funds, private equities and
commodities, with any remainder to be held in cash equivalents. The allocation of plan assets for the defined
benefit pension plans, by asset category as of December 31, 2007 and 2006 is detailed in the table below. As of
December 31, 2006, the plan assets were still in the process of being rebalanced to align with the recently
approved investment policy.
December 31,
Allocation of Plan Assets 2007 2006
U.S. equity securities 43% 54%
International equity securities 13 10
Fixed income securities 31 32
Alternative investments 9—
Cash equivalents 44
Total 100% 100%
111