BB&T 2007 Annual Report Download - page 126
Download and view the complete annual report
Please find page 126 of the 2007 BB&T annual report below. You can navigate through the pages in the report by either clicking on the pages listed below, or by using the keyword search tool below to find specific information within the annual report.-
 1
1 -
2
-
3
-
4
-
5
-
6
-
7
-
8
-
9
-
10
-
11
-
12
-
13
-
14
-
15
-
16
-
17
-
18
-
19
-
20
-
21
-
22
-
23
-
24
-
25
-
26
-
27
-
28
-
29
-
30
-
31
-
32
-
33
-
34
-
35
-
36
-
37
-
38
-
39
-
40
-
41
-
42
-
43
-
44
-
45
-
46
-
47
-
48
-
49
-
50
-
51
-
52
-
53
-
54
-
55
-
56
-
57
-
58
-
59
-
60
-
61
-
62
-
63
-
64
-
65
-
66
-
67
-
68
-
69
-
70
-
71
-
72
-
73
-
74
-
75
-
76
-
77
-
78
-
79
-
80
-
81
-
82
-
83
-
84
-
85
-
86
-
87
-
88
-
89
-
90
-
91
-
92
-
93
-
94
-
95
-
96
-
97
-
98
-
99
-
100
-
101
-
102
-
103
-
104
-
105
-
106
-
107
-
108
-
109
-
110
-
111
-
112
-
113
-
114
-
115
-
 116
116 -
 117
117 -
 118
118 -
 119
119 -
 120
120 -
 121
121 -
 122
122 -
 123
123 -
 124
124 -
 125
125 -
 126
126 -
 127
127 -
 128
128 -
 129
129 -
 130
130 -
 131
131 -
 132
132 -
 133
133 -
 134
134 -
 135
135 -
 136
136 -
137
 |
 |

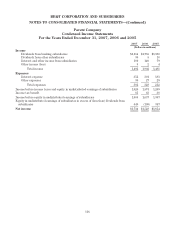
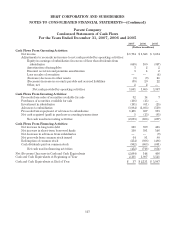
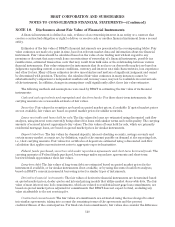
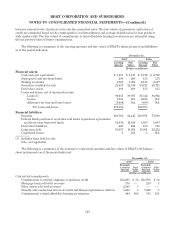
BB&T CORPORATION AND SUBSIDIARIES
NOTES TO CONSOLIDATED FINANCIAL STATEMENTS—(Continued)
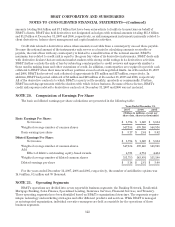
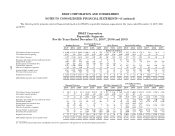
The following table presents selected financial information for BB&T’s reportable business segments for the years ended December 31, 2007, 2006
and 2005.
BB&T Corporation
Reportable Segments
For the Years Ended December 31, 2007, 2006 and 2005
Banking Network Residential Mortgage
Banking Sales Finance Specialized Lending Insurance Services
2007 2006 2005 2007 2006 2005 2007 2006 2005 2007 2006 2005 2007 2006 2005
(Dollars in millions)
Net interest income (expense) $ 2,300 $ 2,385 $ 2,249 $ 1,042 $ 895 $ 741 $ 376 $ 306 $ 259 $ 676 $ 494 $ 374 $ 18 $ 14 $ 8
Net funds transfer pricing 1,137 931 1,183 (788) (648) (493) (255) (194) (140) (219) (118) (73) (4) (4) 3
Net interest income 3,437 3,316 3,432 254 247 248 121 112 119 457 376 301 14 10 11
Economic provision for loan and lease losses 155 145 215 9 9 9 21 21 27 194 137 103 — — —
Noninterest income 1,095 967 884 120 109 113 2 2 1 90 74 59 839 783 689
Intersegment net referral fees 239 223 215 (92) (92) (88) (13) (12) ———— — — —
Noninterest expense 1,473 1,402 1,280 64 53 51 24 23 27 207 163 139 625 624 528
Allocated corporate expenses 588 528 430 10 11 36 10 8 9 25 20 17 28 25 28
Income before income taxes 2,555 2,431 2,606 199 191 177 55 50 57 121 130 101 200 144 144
Provision for income taxes 921 879 861 72 69 56 20 18 18 46 48 31 76 55 56
Segment net income $ 1,634 $ 1,552 $ 1,745 $ 127 $ 122 $ 121 $ 35 $ 32 $ 39 $ 75 $ 82 $ 70 $ 124 $ 89 $ 88
Identifiable segment assets (period end) $60,704 $56,658 $51,304 $18,503 $16,426 $14,661 $5,786 $5,486 $5,076 $5,608 $3,785 $2,968 $ 1,076 $ 1,046 $ 1,046
Financial Services Treasury All Other Segments (1) Parent/Reconciling
Items Total BB&T Corporation
2007 2006 2005 2007 2006 2005 2007 2006 2005 2007 2006 2005 2007 2006 2005
(Dollars in millions)
Net interest income (expense) $ 22 $ 25 $ 19 $ (134) $ (171) $ 30 $ 167 $ 166 $ 140 $ (587) $ (406) $ (295) $ 3,880 $ 3,708 $ 3,525
Net funds transfer pricing 37 19 2 (164) (69) (512) (163) (130) (33) 419 213 63 — — —
Net interest income 59 44 21 (298) (240) (482) 4 36 107 (168) (193) (232) 3,880 3,708 3,525
Economic provision for loan and lease losses — — — — 1 — 1 1 2 68 (74) (139) 448 240 217
Noninterest income 553 547 479 111 117 108 57 66 46 (93) (144) (53) 2,774 2,521 2,326
Intersegment net referral fees 10 18 13 — (1) — — — (1) (144) (136) (139) — — —
Noninterest expense 481 476 408 9 10 7 80 80 54 673 685 673 3,636 3,516 3,167
Allocated corporate expenses 30 35 28 3 7 — 6 6 4 (700) (640) (552) — — —
Income before income taxes 111 98 77 (199) (142) (381) (26) 15 92 (446) (444) (406) 2,570 2,473 2,467
Provision for income taxes 38 36 25 (117) (94) (194) (20) (11) 22 (200) (55) (62) 836 945 813
Segment net income $ 73 $ 62 $ 52 $ (82) $ (48) $ (187) $ (6) $ 26 $ 70 $ (246) $ (389) $ (344) $ 1,734 $ 1,528 $ 1,654
Identifiable segment assets (period end) $ 4,154 $ 2,163 $ 1,643 $24,137 $24,262 $22,024 $3,934 $3,848 $3,562 $8,716 $7,677 $6,886 $132,618 $121,351 $109,170
(1) Includes financial data from subsidiaries below the quantitative and qualitative thresholds requiring disclosure.
126