BB&T 2007 Annual Report Download - page 57
Download and view the complete annual report
Please find page 57 of the 2007 BB&T annual report below. You can navigate through the pages in the report by either clicking on the pages listed below, or by using the keyword search tool below to find specific information within the annual report.-
 1
1 -
2
-
3
-
4
-
5
-
6
-
7
-
8
-
9
-
10
-
11
-
12
-
13
-
14
-
15
-
16
-
17
-
18
-
19
-
20
-
21
-
22
-
23
-
24
-
25
-
26
-
27
-
28
-
29
-
30
-
31
-
32
-
33
-
34
-
35
-
36
-
37
-
38
-
39
-
40
-
41
-
42
-
43
-
44
-
45
-
46
-
 47
47 -
 48
48 -
 49
49 -
 50
50 -
 51
51 -
 52
52 -
 53
53 -
 54
54 -
 55
55 -
 56
56 -
 57
57 -
 58
58 -
 59
59 -
 60
60 -
 61
61 -
 62
62 -
 63
63 -
 64
64 -
 65
65 -
 66
66 -
 67
67 -
68
-
69
-
70
-
71
-
72
-
73
-
74
-
75
-
76
-
77
-
78
-
79
-
80
-
81
-
82
-
83
-
84
-
85
-
86
-
87
-
88
-
89
-
90
-
91
-
92
-
93
-
94
-
95
-
96
-
97
-
98
-
99
-
100
-
101
-
102
-
103
-
104
-
105
-
106
-
107
-
108
-
109
-
110
-
111
-
112
-
113
-
114
-
115
-
116
-
117
-
118
-
119
-
120
-
121
-
122
-
123
-
124
-
125
-
126
-
127
-
128
-
129
-
130
-
131
-
132
-
133
-
134
-
135
-
136
-
137
 |
 |

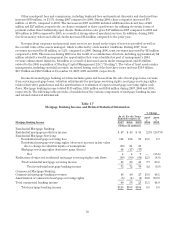
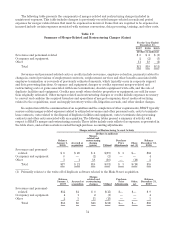
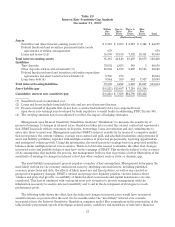
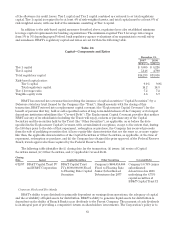
Table 20
Interest Rate Sensitivity Gap Analysis
December 31, 2007
Within
One
Year
One to
Three
Years
Three to
Five
Years
After
Five
Years Total
(Dollars in millions)
Assets
Securities and other interest-earning assets (1,4) $ 8,513 $ 6,339 $ 2,927 $ 6,322 $ 24,101
Federal funds sold and securities purchased under resale
agreements or similar arrangements 679 679
Loans and leases (2,4) 55,993 17,810 7,532 10,351 91,686
Total interest-earning assets 65,185 24,149 10,459 16,673 116,466
Liabilities
Time deposits 37,632 2,653 568 5 40,858
Other deposits with no stated maturity (3) 16,062 4,373 2,299 10,115 32,849
Federal funds purchased and securities sold under repurchase
agreements and short-term borrowed funds (4) 9,758 876 10,634
Long-term debt (4) 9,944 350 482 7,917 18,693
Total interest-bearing liabilities 73,396 8,252 3,349 18,037 103,034
Asset-liability gap $ (8,211) $15,897 $ 7,110 $ (1,364)
Cumulative interest rate sensitivity gap $ (8,211) $ 7,686 $14,796 $13,432
(1) Securities based on amortized cost.
(2) Loans and leases include loans held for sale and are net of unearned income.
(3) Projected runoff of deposits that do not have a contractual maturity date was computed based
upon decay rate assumptions developed by bank regulators to assist banks in addressing FDICIA rule 305.
(4) The carrying amounts have been adjusted to reflect the impact of hedging strategies.
Management uses Interest Sensitivity Simulation Analysis (“Simulation”) to measure the sensitivity of
projected earnings to changes in interest rates. Simulation takes into account the current contractual agreements
that BB&T has made with its customers on deposits, borrowings, loans, investments and any commitments to
enter into those transactions. Management monitors BB&T’s interest sensitivity by means of a computer model
that incorporates the current volumes, average rates earned and paid, and scheduled maturities and payments of
asset and liability portfolios, together with multiple scenarios of projected prepayments, repricing opportunities
and anticipated volume growth. Using this information, the model projects earnings based on projected portfolio
balances under multiple interest rate scenarios. This level of detail is needed to simulate the effect that changes
in interest rates and portfolio balances may have on the earnings of BB&T. This method is subject to the accuracy
of the assumptions that underlie the process, but management believes that it provides a better illustration of the
sensitivity of earnings to changes in interest rates than other analyses such as static or dynamic gap.
The asset/liability management process requires a number of key assumptions. Management determines the
most likely outlook for the economy and interest rates by analyzing external factors, including published
economic projections and data, the effects of likely monetary and fiscal policies, as well as any enacted or
prospective regulatory changes. BB&T’s current and prospective liquidity position, current balance sheet
volumes and projected growth, accessibility of funds for short-term needs and capital maintenance are also
considered. This data is combined with various interest rate scenarios to provide management with the
information necessary to analyze interest sensitivity and to aid in the development of strategies to reach
performance goals.
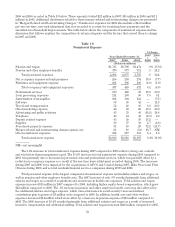
The following table shows the effect that the indicated changes in interest rates would have on interest
sensitive income as projected for the next twelve months under the “most likely” interest rate scenario
incorporated into the Interest Sensitivity Simulation computer model. Key assumptions in the preparation of the
table include prepayment speeds of mortgage-related assets, cash flows and maturities of derivative financial
57