BB&T 2007 Annual Report Download - page 65
Download and view the complete annual report
Please find page 65 of the 2007 BB&T annual report below. You can navigate through the pages in the report by either clicking on the pages listed below, or by using the keyword search tool below to find specific information within the annual report.-
 1
1 -
2
-
3
-
4
-
5
-
6
-
7
-
8
-
9
-
10
-
11
-
12
-
13
-
14
-
15
-
16
-
17
-
18
-
19
-
20
-
21
-
22
-
23
-
24
-
25
-
26
-
27
-
28
-
29
-
30
-
31
-
32
-
33
-
34
-
35
-
36
-
37
-
38
-
39
-
40
-
41
-
42
-
43
-
44
-
45
-
46
-
47
-
48
-
49
-
50
-
51
-
52
-
53
-
54
-
 55
55 -
 56
56 -
 57
57 -
 58
58 -
 59
59 -
 60
60 -
 61
61 -
 62
62 -
 63
63 -
 64
64 -
 65
65 -
 66
66 -
 67
67 -
 68
68 -
 69
69 -
 70
70 -
 71
71 -
 72
72 -
 73
73 -
 74
74 -
 75
75 -
76
-
77
-
78
-
79
-
80
-
81
-
82
-
83
-
84
-
85
-
86
-
87
-
88
-
89
-
90
-
91
-
92
-
93
-
94
-
95
-
96
-
97
-
98
-
99
-
100
-
101
-
102
-
103
-
104
-
105
-
106
-
107
-
108
-
109
-
110
-
111
-
112
-
113
-
114
-
115
-
116
-
117
-
118
-
119
-
120
-
121
-
122
-
123
-
124
-
125
-
126
-
127
-
128
-
129
-
130
-
131
-
132
-
133
-
134
-
135
-
136
-
137
 |
 |

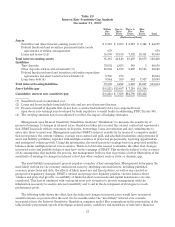
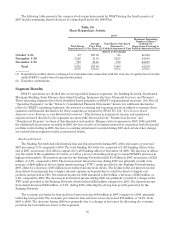
The following table presents the common stock repurchases made by BB&T during the fourth quarter of
2007 and the remaining shares that may be repurchased under the 2006 Plan.
Table 26
Share Repurchase Activity
2007
Total Shares
Repurchased (1)
Average
Price Paid
Per Share (2)
Total Shares Purchased
Pursuant to
Publicly-Announced Plan
Maximum Remaining
Number of Shares
Available for
Repurchase Pursuant to
Publicly-Announced Plan
(Shares in thousands)
October 1-31 27 $37.08 25 48,014
November 1-30 3,126 33.85 3,125 44,889
December 1-31 759 32.45 750 44,139
Total 3,912 $33.60 3,900 44,139
(1) Repurchases reflect shares exchanged or surrendered in connection with the exercise of equity-based awards
under BB&T's equity-based compensation plans.
(2) Excludes commissions.
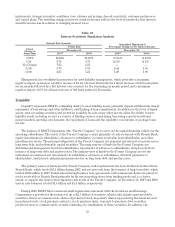
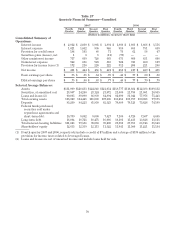
Segment Results
BB&T’s operations are divided into seven reportable business segments: the Banking Network, Residential
Mortgage Banking, Sales Finance, Specialized Lending, Insurance Services, Financial Services, and Treasury.
These operating segments have been identified based primarily on BB&T’s organizational structure. See Note 21
“Operating Segments”, in the “Notes to Consolidated Financial Statements” herein, for additional disclosures
related to BB&T’s operating segments, the internal accounting and reporting practices utilized to manage these
segments and financial disclosures for these segments as required by SFAS No. 131, “Disclosures about
Segments of an Enterprise and Related Information.” Fluctuations in noninterest income and noninterest
expense incurred directly by the segments are more fully discussed in the “Noninterest Income” and
“Noninterest Expense” sections of this discussion and analysis. Merger-related expenses in 2007, 2006 and 2005,
the additional tax provision recorded in 2006, the loss on sales of securities incurred in connection with the partial
portfolio restructuring in 2006, the lease accounting adjustment recorded during 2005 and certain other charges
are excluded from segment results as presented herein.
Banking Network
The Banking Network had solid internal loan and deposit growth during 2007, with total assets at year-end
2007 increasing 7.1% compared to 2006. The total Banking Network was composed of 1,492 banking offices at the
end of 2007, an increase of 33 offices compared to 1,459 banking offices at December 31, 2006. The increase in offices
was the result of the acquisition of Coastal, as well as a de novo branching strategy to expand BB&T’s presence in
high growth markets. Net interest income for the Banking Network totaled $3.4 billion in 2007, an increase of $121
million, or 3.6%, compared to 2006. The increase in net interest income during 2007 was primarily a result of an
increase of $206 million in the net funds transfer pricing (“FTP”) credit provided to the Banking Network during
2007, offset by a decrease of $85 million in net interest income from clients. The decline in the net interest income
from clients was primarily due to higher interest expense on deposits due to a shift by clients to higher cost
products and growth in CDs. Net interest income for 2006 amounted to $3.3 billion, a decrease of $116 million, or
3.4%, compared to 2005. The decrease in net interest income during 2006 was primarily a result of a change in the
FTP credit provided to the Banking Network, which declined $252 million compared to 2005. Net interest income
from clients increased $136 million, or 6.0%, during 2006, reflecting the strong loan growth generated by the
Banking Network.
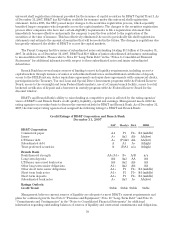
The economic provision for loan and lease losses increased $10 million in 2007 compared to 2006, primarily
reflecting loan growth. The economic provision for loan and lease losses decreased $70 million, or 32.6%, from
2005 to 2006. The decrease during 2006 was primarily due to a change in loss rates for allocating the economic
provision for loan and lease losses to the segments.
65