BB&T 2007 Annual Report Download - page 68
Download and view the complete annual report
Please find page 68 of the 2007 BB&T annual report below. You can navigate through the pages in the report by either clicking on the pages listed below, or by using the keyword search tool below to find specific information within the annual report.-
 1
1 -
2
-
3
-
4
-
5
-
6
-
7
-
8
-
9
-
10
-
11
-
12
-
13
-
14
-
15
-
16
-
17
-
18
-
19
-
20
-
21
-
22
-
23
-
24
-
25
-
26
-
27
-
28
-
29
-
30
-
31
-
32
-
33
-
34
-
35
-
36
-
37
-
38
-
39
-
40
-
41
-
42
-
43
-
44
-
45
-
46
-
47
-
48
-
49
-
50
-
51
-
52
-
53
-
54
-
55
-
56
-
57
-
 58
58 -
 59
59 -
 60
60 -
 61
61 -
 62
62 -
 63
63 -
 64
64 -
 65
65 -
 66
66 -
 67
67 -
 68
68 -
 69
69 -
 70
70 -
 71
71 -
 72
72 -
 73
73 -
 74
74 -
 75
75 -
 76
76 -
 77
77 -
 78
78 -
79
-
80
-
81
-
82
-
83
-
84
-
85
-
86
-
87
-
88
-
89
-
90
-
91
-
92
-
93
-
94
-
95
-
96
-
97
-
98
-
99
-
100
-
101
-
102
-
103
-
104
-
105
-
106
-
107
-
108
-
109
-
110
-
111
-
112
-
113
-
114
-
115
-
116
-
117
-
118
-
119
-
120
-
121
-
122
-
123
-
124
-
125
-
126
-
127
-
128
-
129
-
130
-
131
-
132
-
133
-
134
-
135
-
136
-
137
 |
 |
The provision for income taxes allocated to the Specialized Lending segment decreased $2 million in 2007
compared to 2006, primarily as a result of lower pretax income. Comparing 2006 to 2005, the provision for income
taxes increased $17 million, or 54.8%, as a result of higher pretax income and a change in methodology for
allocating taxes to the segments.
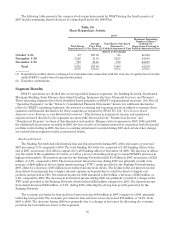
Total identifiable assets for the Specialized Lending segment increased $1.8 billion, or 48.2%, from 2007 to
2006 due to internal growth and the acquisitions of AFCO and Collateral. Comparing 2006 to 2005, total
identifiable assets increased $817 million, or 27.5%.
Insurance Services
Noninterest income produced by the Insurance Services segment totaled $839 million during 2007, an
increase of $56 million, or 7.2%, compared to 2006. The growth during 2007 includes a gain of $19 million from the
sale of an insurance agency operation. Comparing 2006 to 2005, noninterest income increased $94 million, or
13.6%. Internal growth combined with the expansion of BB&T’s insurance agency network and insurance
brokerage operations through acquisitions during the last two years were responsible for the growth in
noninterest income. Noninterest expenses incurred within the Insurance Services segment and allocated
corporate expenses increased slightly during 2007 reflecting strong expense control. Comparing 2006 to 2005,
noninterest expenses increased $96 million, or 18.2%, while allocated corporate expenses decreased $3 million, or
10.7%. The overall increase in noninterest expenses within the Insurance Services segment during 2006
principally resulted from the continued expansion of the BB&T insurance agency network.
The changes in the provision for income taxes allocated to the Insurance Services segment were largely
consistent with changes in the levels of pretax income for the years 2007 compared to 2006 and 2006 compared to
2005.
Financial Services
Net interest income for the Financial Services segment totaled $59 million in 2007, an increase of $15 million,
or 34.1%, compared to 2006. Comparing 2006 to 2005, net interest income increased $23 million, or 109.5%. The
increases in net interest income over the past two years were largely due to higher FTP credits received by the
Financial Services segment.
Noninterest income in the Financial Services segment in 2007 totaled $553 million, a slight increase
compared to $547 million earned during 2006, which was up $68 million, or 14.2%, compared to 2005. The revenue
increase in 2006 was due to strong growth from trust operations and investment banking and brokerage
operations, which includes the impact of acquisitions. Noninterest expenses incurred by Financial Services in
2007 were up slightly compared to 2006, after increasing $68 million in the prior year. The increase in noninterest
expenses in 2006 was largely due to increased personnel costs as a result of additional staffing and higher
incentive compensation.
The provision for income taxes allocated to Financial Services increased $2 million in 2007 compared to 2006,
following an increase of $11 million in 2006 compared to 2005. While pretax income increased 13.3% in 2007
compared to 2006, the provision for income taxes only increased 5.6% due to a higher level of tax exempt income
earned in 2007. The increase in the provision for income taxes allocated to the Financial Services segment in 2006
compared to 2005 was primarily a result of a change in the effective tax rate used to allocate taxes to the
segments. Total identifiable segment assets for Financial Services increased to a total of $4.2 billion at
December 31, 2007, compared to $2.2 billion at year-end 2006 and $1.6 billion at December 31, 2005.
Treasury
Net interest income for the Treasury segment was an expense of $298 million in 2007 compared to an
expense of $240 million in 2006. Net interest income for 2007 consisted of $134 million of net interest expense and
$164 million of expense from the FTP charge. For 2006, net interest income for the Treasury segment consisted of
$171 million of net interest expense and $69 million of expense from the FTP charge. The improvement in net
interest income from external sources was primarily due to slower growth in funding costs compared to growth in
68