BB&T 2007 Annual Report Download - page 94
Download and view the complete annual report
Please find page 94 of the 2007 BB&T annual report below. You can navigate through the pages in the report by either clicking on the pages listed below, or by using the keyword search tool below to find specific information within the annual report.-
 1
1 -
2
-
3
-
4
-
5
-
6
-
7
-
8
-
9
-
10
-
11
-
12
-
13
-
14
-
15
-
16
-
17
-
18
-
19
-
20
-
21
-
22
-
23
-
24
-
25
-
26
-
27
-
28
-
29
-
30
-
31
-
32
-
33
-
34
-
35
-
36
-
37
-
38
-
39
-
40
-
41
-
42
-
43
-
44
-
45
-
46
-
47
-
48
-
49
-
50
-
51
-
52
-
53
-
54
-
55
-
56
-
57
-
58
-
59
-
60
-
61
-
62
-
63
-
64
-
65
-
66
-
67
-
68
-
69
-
70
-
71
-
72
-
73
-
74
-
75
-
76
-
77
-
78
-
79
-
80
-
81
-
82
-
83
-
 84
84 -
 85
85 -
 86
86 -
 87
87 -
 88
88 -
 89
89 -
 90
90 -
 91
91 -
 92
92 -
 93
93 -
 94
94 -
 95
95 -
 96
96 -
 97
97 -
 98
98 -
 99
99 -
 100
100 -
 101
101 -
 102
102 -
 103
103 -
 104
104 -
105
-
106
-
107
-
108
-
109
-
110
-
111
-
112
-
113
-
114
-
115
-
116
-
117
-
118
-
119
-
120
-
121
-
122
-
123
-
124
-
125
-
126
-
127
-
128
-
129
-
130
-
131
-
132
-
133
-
134
-
135
-
136
-
137
 |
 |

BB&T CORPORATION AND SUBSIDIARIES
NOTES TO CONSOLIDATED FINANCIAL STATEMENTS—(Continued)
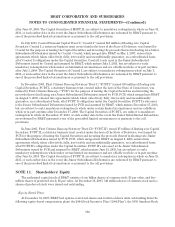
During 2006, management made a change to BB&T’s segment reporting resulting in a reallocation of $93
million of goodwill from the Banking Network segment to the Sales Finance segment.
The following table presents the gross carrying amounts and accumulated amortization for BB&T’s
identifiable intangible assets subject to amortization at the dates presented:
Identifiable Intangible Assets
As of December 31, 2007 As of December 31, 2006
Gross
Carrying
Amount Accumulated
Amortization
Net
Carrying
Amount
Gross
Carrying
Amount Accumulated
Amortization
Net
Carrying
Amount
(Dollars in millions)
Identifiable intangible assets
Core deposit intangibles $ 457 $(284) $173 $413 $(235) $178
Other (1) 566 (250) 316 471 (195) 276
Totals $1,023 $(534) $489 $884 $(430) $454
(1) Other identifiable intangibles are primarily customer relationship intangibles.
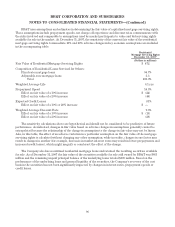
During the years ended December 31, 2007, 2006 and 2005, BB&T incurred $104 million, $104 million and
$112 million, respectively, in pretax amortization expenses associated with core deposit intangibles and other
intangible assets. At December 31, 2007, the weighted-average remaining life of core deposit intangibles and
other identifiable intangibles was 11.3 years and 11.7 years, respectively.
Estimated amortization expense of identifiable intangible assets for each of the next five years total $93
million (2008), $77 million (2009), $65 million (2010), $54 million (2011) and $43 million (2012).
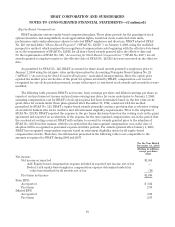
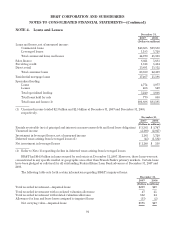
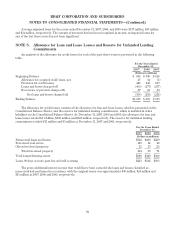
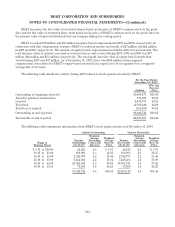
NOTE 8. Loan Servicing
BB&T has two classes of mortgage servicing rights for which it separately manages the economic risks: residential
and commercial. Commercial mortgage servicing rights are recorded as other assets on the Consolidated Balance Sheets
at lower of cost or market and amortized in proportion to and over the estimated period that net servicing income is
expected to be received based on projections of the amount and timing of estimated future net cash flows. As of
January 1, 2006, residential mortgage servicing rights are recorded on the Consolidated Balance Sheets at fair value with
changes in fair value recorded as a component of mortgage banking income in the Consolidated Statements of Income for
each period. Prior to January 1, 2006, residential mortgage servicing rights were recorded at lower of cost or market and
amortized over the estimated period that servicing income is expected to be received based on projections of the amount
and timing of estimated future cash flows. BB&T uses various derivative instruments to mitigate the income statement
effect of changes in fair value, due to changes in valuation inputs and assumptions, of its residential mortgage servicing
rights. The following is an analysis of the activity in BB&T’s residential mortgage servicing rights for the years ended
December 31, 2007 and 2006 based on the fair value method of accounting:
Residential
Mortgage Servicing Rights
For the Years Ended
December 31,
2007 2006
(Dollars in millions)
Carrying value, January 1, $484 $431
Additions 134 94
Purchases 418
Increase (decrease) in fair value:
Due to changes in valuation inputs or assumptions (60) 21
Other changes (1) (90) (80)
Carrying value, December 31, $472 $484
(1) Represents the realization of expected net servicing cash flows, expected borrower payments and the passage of time.
94