BB&T 2007 Annual Report Download - page 64
Download and view the complete annual report
Please find page 64 of the 2007 BB&T annual report below. You can navigate through the pages in the report by either clicking on the pages listed below, or by using the keyword search tool below to find specific information within the annual report.-
 1
1 -
2
-
3
-
4
-
5
-
6
-
7
-
8
-
9
-
10
-
11
-
12
-
13
-
14
-
15
-
16
-
17
-
18
-
19
-
20
-
21
-
22
-
23
-
24
-
25
-
26
-
27
-
28
-
29
-
30
-
31
-
32
-
33
-
34
-
35
-
36
-
37
-
38
-
39
-
40
-
41
-
42
-
43
-
44
-
45
-
46
-
47
-
48
-
49
-
50
-
51
-
52
-
53
-
 54
54 -
 55
55 -
 56
56 -
 57
57 -
 58
58 -
 59
59 -
 60
60 -
 61
61 -
 62
62 -
 63
63 -
 64
64 -
 65
65 -
 66
66 -
 67
67 -
 68
68 -
 69
69 -
 70
70 -
 71
71 -
 72
72 -
 73
73 -
 74
74 -
75
-
76
-
77
-
78
-
79
-
80
-
81
-
82
-
83
-
84
-
85
-
86
-
87
-
88
-
89
-
90
-
91
-
92
-
93
-
94
-
95
-
96
-
97
-
98
-
99
-
100
-
101
-
102
-
103
-
104
-
105
-
106
-
107
-
108
-
109
-
110
-
111
-
112
-
113
-
114
-
115
-
116
-
117
-
118
-
119
-
120
-
121
-
122
-
123
-
124
-
125
-
126
-
127
-
128
-
129
-
130
-
131
-
132
-
133
-
134
-
135
-
136
-
137
 |
 |

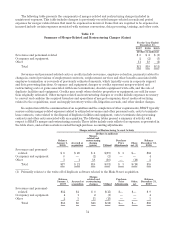
accomplish this while retaining sufficient capital to support future growth and to meet regulatory requirements.
BB&T’s common dividend payout ratio, computed by dividing dividends paid per common share by basic earnings
per common share, was 55.52% in 2007 as compared to 56.34% in 2006. BB&T’s annual cash dividends paid per
common share increased 10.0% during 2007 to $1.76 per common share for the year, as compared to $1.60 per
common share in 2006. This increase marked the 36th consecutive year that the Corporation’s annual cash
dividend paid to shareholders has been increased. A discussion of dividend restrictions is included in Note 16
“Regulatory Requirements and Other Restrictions” in the “Notes to Consolidated Financial Statements” and in
the “Regulatory Considerations” section.
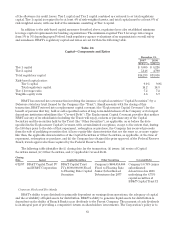
BB&T’s common stock is traded on the New York Stock Exchange (“NYSE”) under the symbol “BBT”. BB&T’s
common stock was held by approximately 324,000 shareholders at December 31, 2007 compared to approximately
259,000 at December 31, 2006. The accompanying table, “Quarterly Summary of Market Prices and Dividends Paid on
Common Stock,” sets forth the quarterly high and low trading prices and closing sales prices for BB&T’s common
stock and the dividends paid per share of common stock for each of the last eight quarters.
Table 25
Quarterly Summary of Market Prices and Cash Dividends Paid on Common Stock
2007 2006
Sales Prices Cash
Dividends
Paid
Sales Prices Cash
Dividends
PaidHigh Low Last High Low Last
Quarter Ended:
March 31 $44.30 $39.54 $41.02 $ .42 $42.85 $38.24 $39.20 $ .38
June 30 43.02 39.13 40.68 .42 43.46 39.09 41.59 .38
September 30 43.00 36.95 40.39 .46 44.54 39.87 43.78 .42
December 31 42.61 30.36 30.67 .46 44.74 42.48 43.93 .42
Year $44.30 $30.36 $30.67 $1.76 $44.74 $38.24 $43.93 $1.60
Share Repurchases
BB&T has periodically repurchased shares of its own common stock. During the years ended December 31,
2007, 2006 and 2005, BB&T repurchased 7 million shares, 22 million shares and 12 million shares of common stock,
respectively. In accordance with North Carolina law, repurchased shares cannot be held as treasury stock, but
revert to the status of authorized and unissued shares.
On June 27, 2006, BB&T’s Board of Directors granted authority under a new share repurchase plan (the
“2006 Plan”) for the repurchase of up to 50 million shares of BB&T’s common stock as needed for general
corporate purposes. The 2006 Plan also authorizes the repurchase of the remaining shares from the previous
authorization. The 2006 Plan remains in effect until all the authorized shares are repurchased unless modified by
the Board of Directors.
64