BB&T 2007 Annual Report Download - page 38
Download and view the complete annual report
Please find page 38 of the 2007 BB&T annual report below. You can navigate through the pages in the report by either clicking on the pages listed below, or by using the keyword search tool below to find specific information within the annual report.-
 1
1 -
2
-
3
-
4
-
5
-
6
-
7
-
8
-
9
-
10
-
11
-
12
-
13
-
14
-
15
-
16
-
17
-
18
-
19
-
20
-
21
-
22
-
23
-
24
-
25
-
26
-
27
-
 28
28 -
 29
29 -
 30
30 -
 31
31 -
 32
32 -
 33
33 -
 34
34 -
 35
35 -
 36
36 -
 37
37 -
 38
38 -
 39
39 -
 40
40 -
 41
41 -
 42
42 -
 43
43 -
 44
44 -
 45
45 -
 46
46 -
 47
47 -
 48
48 -
49
-
50
-
51
-
52
-
53
-
54
-
55
-
56
-
57
-
58
-
59
-
60
-
61
-
62
-
63
-
64
-
65
-
66
-
67
-
68
-
69
-
70
-
71
-
72
-
73
-
74
-
75
-
76
-
77
-
78
-
79
-
80
-
81
-
82
-
83
-
84
-
85
-
86
-
87
-
88
-
89
-
90
-
91
-
92
-
93
-
94
-
95
-
96
-
97
-
98
-
99
-
100
-
101
-
102
-
103
-
104
-
105
-
106
-
107
-
108
-
109
-
110
-
111
-
112
-
113
-
114
-
115
-
116
-
117
-
118
-
119
-
120
-
121
-
122
-
123
-
124
-
125
-
126
-
127
-
128
-
129
-
130
-
131
-
132
-
133
-
134
-
135
-
136
-
137
 |
 |

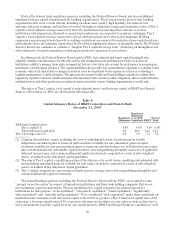
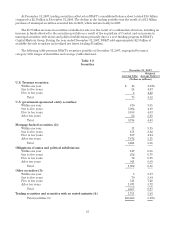
(1) Yields on tax-exempt securities are calculated on a taxable-equivalent basis using the statutory federal
income tax rate of 35%. Yields for available-for-sale securities are calculated based on the amortized cost of
the securities.
(2) For purposes of the maturity table, mortgage-backed securities, which are not due at a single maturity date,
have been allocated over maturity groupings based on the weighted average contractual maturities of
underlying collateral.
(3) Includes privately-issued mortgage-backed securities totaling $1.7 billion. For purposes of the maturity
table, these securities, which are not due at a single maturity date, have been allocated over maturity
groupings based on the weighted average contractual maturities of underlying collateral.
(4) Trading securities and securities with no stated maturity include equity investments that totaled $742
million and trading securities that totaled $1.0 billion.
(5) Includes securities available-for-sale and trading securities carried at estimated fair values of $22.4
billion and $1.0 billion, respectively.
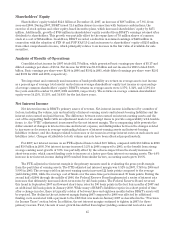
The market value of the available-for-sale portfolio at year-end 2007 was $45 million lower than the
amortized cost of these securities. At December 31, 2007, BB&T’s available-for-sale portfolio had net unrealized
losses, net of deferred income taxes, of $28 million, which are reported as a component of shareholders’ equity. At
December 31, 2006, the available-for-sale portfolio had net unrealized losses of $249 million, net of deferred
income taxes. The improvement in the fair value of the securities available-for-sale portfolio during 2007 was
primarily a result of a decline in interest rates in the marketplace at December 31, 2007 compared to the prior
year-end.
On December 31, 2007, BB&T held certain investment securities having continuous unrealized loss positions
for more than 12 months. As of December 31, 2007, the unrealized losses on these securities totaled $36 million.
Substantially all of these investments were in U.S. government-sponsored entity securities and mortgage-backed
securities, which primarily consist of securities issued by the Federal Farm Credit Bureau, the Federal Home
Loan Bank System, the Federal National Mortgage Association and the Federal Home Loan Mortgage
Corporation. These agencies are rated AAA and the unrealized losses are the result of increases in market
interest rates compared to the date the securities were acquired rather than the credit quality of the issuers. At
December 31, 2007, BB&T had the ability and intent to retain these securities for a period of time sufficient to
recover all unrealized losses. Accordingly, BB&T has not recognized any other-than-temporary impairment in
connection with these securities during 2007.
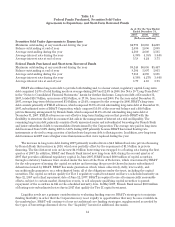
The fully taxable equivalent (“FTE”) yield on the total securities portfolio was 5.05% for the year ended
December 31, 2007, compared to 4.48% for the prior year. The increase in FTE yield resulted principally from the
changes in the overall composition of the securities portfolio with a larger concentration of higher-yielding
mortgage-backed securities and other securities, which primarily consist of privately-issued mortgage backed
securities. The yield on U.S. government-sponsored entity securities increased from 4.02% in 2006 to 4.58% in
2007, while the yield on mortgage-backed securities increased from 4.97% to 5.15% and the FTE yield on state
and municipal securities decreased from 6.89% last year to 6.65% in the current year. The yield on other securities
increased from 5.82% during 2006 to 6.35% in 2007.
Loans and Leases
BB&T emphasizes commercial lending to small and medium-sized businesses, consumer lending, mortgage
lending and specialized lending with an overall goal of maximizing the profitability of the loan portfolio while
maintaining strong asset quality. The various categories of loan products offered by BB&T are discussed under
“Lending Activities” in the “Overview and Description of Business” section herein. BB&T is a full-service lender
with approximately one-half of its loan portfolio to businesses and one-half to individual consumers. Average
commercial loans, including lease receivables, comprised 48.3% of the loan portfolio during 2007, compared to
49.1% in 2006. Average consumer loans, which include sales finance, revolving credit and direct retail, comprised
26.0% of average loans in 2007, compared to 27.3% in 2006. Average mortgage loans comprised 19.9% of average
total loans for 2007, compared to 19.5% a year ago. Average loans originated by BB&T’s specialized lending
subsidiaries represented the remaining 5.8% of average total loans in 2007, compared to 4.1% during the prior
year.
38