BB&T 2007 Annual Report Download - page 70
Download and view the complete annual report
Please find page 70 of the 2007 BB&T annual report below. You can navigate through the pages in the report by either clicking on the pages listed below, or by using the keyword search tool below to find specific information within the annual report.-
 1
1 -
2
-
3
-
4
-
5
-
6
-
7
-
8
-
9
-
10
-
11
-
12
-
13
-
14
-
15
-
16
-
17
-
18
-
19
-
20
-
21
-
22
-
23
-
24
-
25
-
26
-
27
-
28
-
29
-
30
-
31
-
32
-
33
-
34
-
35
-
36
-
37
-
38
-
39
-
40
-
41
-
42
-
43
-
44
-
45
-
46
-
47
-
48
-
49
-
50
-
51
-
52
-
53
-
54
-
55
-
56
-
57
-
58
-
59
-
 60
60 -
 61
61 -
 62
62 -
 63
63 -
 64
64 -
 65
65 -
 66
66 -
 67
67 -
 68
68 -
 69
69 -
 70
70 -
 71
71 -
 72
72 -
 73
73 -
 74
74 -
 75
75 -
 76
76 -
 77
77 -
 78
78 -
 79
79 -
 80
80 -
81
-
82
-
83
-
84
-
85
-
86
-
87
-
88
-
89
-
90
-
91
-
92
-
93
-
94
-
95
-
96
-
97
-
98
-
99
-
100
-
101
-
102
-
103
-
104
-
105
-
106
-
107
-
108
-
109
-
110
-
111
-
112
-
113
-
114
-
115
-
116
-
117
-
118
-
119
-
120
-
121
-
122
-
123
-
124
-
125
-
126
-
127
-
128
-
129
-
130
-
131
-
132
-
133
-
134
-
135
-
136
-
137
 |
 |

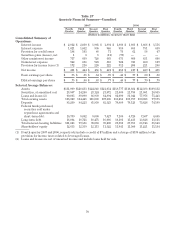
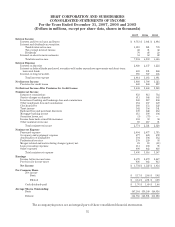
Table 27
Quarterly Financial Summary—Unaudited
2007 2006
Fourth
Quarter Third
Quarter Second
Quarter First
Quarter Fourth
Quarter Third
Quarter Second
Quarter First
Quarter
(Dollars in millions, except per share data)
Consolidated Summary of
Operations:
Interest income $ 2,012 $ 2,030 $ 1,961 $ 1,891 $ 1,866 $ 1,803 $ 1,668 $ 1,556
Interest expense 1,021 1,052 995 946 910 865 751 659
Provision for credit losses 184 105 88 71 73 62 58 47
Securities gains (losses) , net 1 6 1 (11) (73) — — —
Other noninterest income 717 669 728 663 675 660 651 608
Noninterest expense 942 888 923 883 922 915 860 819
Provision for income taxes (1) 172 216 226 222 312 204 221 208
Net income $ 411 $ 444 $ 458 $ 421 $ 251 $ 417 $ 429 $ 431
Basic earnings per share $ .75 $ .81 $ .84 $ .78 $ .46 $ .77 $ .80 $ .80
Diluted earnings per share $ .75 $ .80 $ .83 $ .77 $ .46 $ .77 $ .79 $ .79
Selected Average Balances:
Assets $131,009 $128,633 $124,848 $121,054 $118,777 $116,884 $112,383 $109,132
Securities, at amortized cost 23,967 24,246 23,124 21,872 21,609 21,736 21,081 20,955
Loans and leases (2) 90,805 89,090 86,939 84,894 82,690 81,044 77,978 75,443
Total earning assets 116,029 114,441 111,030 107,606 105,216 103,757 100,028 97,175
Deposits 85,260 84,223 81,959 82,523 79,889 79,123 75,626 74,199
Federal funds purchased,
securities sold under
repurchase agreements and
short-term debt 10,739 9,892 9,000 7,627 7,109 6,720 7,507 6,685
Long-term debt 18,864 18,721 18,471 16,086 16,101 15,433 13,826 13,111
Total interest-bearing liabilities 101,823 99,588 96,063 93,290 89,810 87,765 83,746 81,143
Shareholders' equity 12,655 12,359 12,113 11,522 11,941 11,500 11,221 11,134
(1) Fourth quarter 2007 and 2006, respectively include a credit of $7 million and a charge of $139 million to the
provision for income taxes related to leveraged leases.
(2) Loans and leases are net of unearned income and include loans held for sale.
70