BB&T 2007 Annual Report Download - page 53
Download and view the complete annual report
Please find page 53 of the 2007 BB&T annual report below. You can navigate through the pages in the report by either clicking on the pages listed below, or by using the keyword search tool below to find specific information within the annual report.-
 1
1 -
2
-
3
-
4
-
5
-
6
-
7
-
8
-
9
-
10
-
11
-
12
-
13
-
14
-
15
-
16
-
17
-
18
-
19
-
20
-
21
-
22
-
23
-
24
-
25
-
26
-
27
-
28
-
29
-
30
-
31
-
32
-
33
-
34
-
35
-
36
-
37
-
38
-
39
-
40
-
41
-
42
-
 43
43 -
 44
44 -
 45
45 -
 46
46 -
 47
47 -
 48
48 -
 49
49 -
 50
50 -
 51
51 -
 52
52 -
 53
53 -
 54
54 -
 55
55 -
 56
56 -
 57
57 -
 58
58 -
 59
59 -
 60
60 -
 61
61 -
 62
62 -
 63
63 -
64
-
65
-
66
-
67
-
68
-
69
-
70
-
71
-
72
-
73
-
74
-
75
-
76
-
77
-
78
-
79
-
80
-
81
-
82
-
83
-
84
-
85
-
86
-
87
-
88
-
89
-
90
-
91
-
92
-
93
-
94
-
95
-
96
-
97
-
98
-
99
-
100
-
101
-
102
-
103
-
104
-
105
-
106
-
107
-
108
-
109
-
110
-
111
-
112
-
113
-
114
-
115
-
116
-
117
-
118
-
119
-
120
-
121
-
122
-
123
-
124
-
125
-
126
-
127
-
128
-
129
-
130
-
131
-
132
-
133
-
134
-
135
-
136
-
137
 |
 |
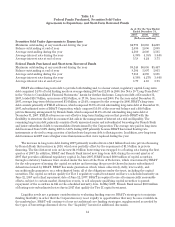
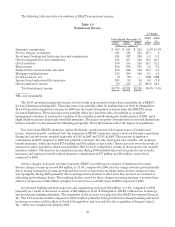
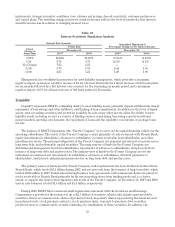
including higher insurance incentive compensation, investment banking incentive compensation and other annual
incentive compensation of $37 million, $17 million and $10 million, respectively. Incentive commissions related to
mortgage banking activities declined $7 million in 2006 compared to 2005. In addition, BB&T adopted SFAS
123(R) on January 1, 2006 and recorded compensation expense related to its equity-based awards in 2006 of $58
million. The 21.2% increase in pension and other employee benefit costs was also affected by the additional
salaries and wages expense, which caused increases in social security taxes and defined contribution plan
expenses of $8 million each compared to 2005. In addition, expense related to post-employment benefits,
excluding defined contribution plan expenses, increased $18 million and health care and other welfare expenses
increased $14 million compared to 2005. Additional disclosures relating to BB&T’s benefit plans can be found in
Note 14 “Benefit Plans” in the “Notes to Consolidated Financial Statements.”
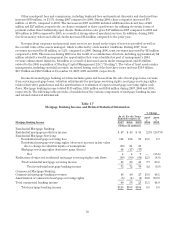
Net occupancy and equipment expense increased $28 million, or 6.2%, in 2007. The increase in 2007 was
largely a result of increased lease expenses due to BB&T’s de novo branching strategy. During 2006, net
occupancy and equipment expense decreased by $23 million, or 4.9%. The decrease in 2006 compared to 2005 was
primarily the result of the $44 million one-time lease adjustment previously mentioned. This decrease was
partially offset by increases as a result of BB&T’s de novo branching strategy, additional rent from new leases
and other increases.
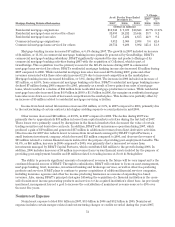
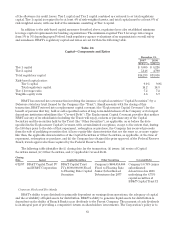
Amortization expense associated with intangible assets was flat in 2007 compared to 2006. The decrease of
7.1% in amortization expense associated with intangible assets in 2006 compared to 2005 primarily resulted from
decreases from declining balance amortization methods for past acquisitions. These decreases were partially
offset by additional amortization due to the acquisitions of Main Street and First Citizens during 2006. See Note 2
“Business Combinations” in the “Notes to Consolidated Financial Statements” for a summary of completed
mergers and acquisitions during the three year period ended December 31, 2007.
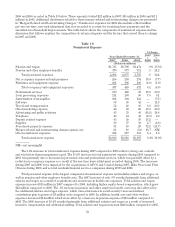
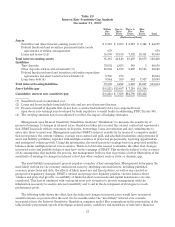
Other noninterest expenses, including loan processing expenses and professional services, increased $72
million, or 8.3%, compared to 2006, which reflected an increase of $59 million, or 7.3%, compared to 2005. The 2007
increase was primarily the result of increases in professional services, marketing expenses, foreclosed property
expenses and loan processing costs. The 2006 increase reflected higher advertising expenses, professional
services expenses, travel and transportation costs and software expenses. The increases for 2007 and 2006 were
impacted by acquisitions completed during the past two years. Please refer to Table 18 for additional detail on
fluctuations in other categories of noninterest expense.
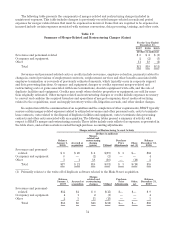
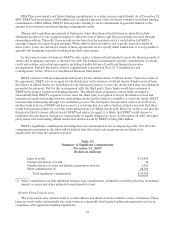
Merger-Related and Restructuring Charges
BB&T recorded certain merger-related and restructuring charges or credits during the years 2007, 2006 and
2005. These charges or credits are reflected in BB&T’s Consolidated Statements of Income as a category of
noninterest expense. Please Refer to Note 2 “Business Combinations” in the “Notes to Consolidated Financial
Statements” for a summary of mergers and acquisitions consummated during the three years ended
December 31, 2007.
During 2007, BB&T recorded merger-related and restructuring charges of $21 million, which are reflected in
BB&T’s Consolidated Statements of Income as noninterest expenses. These expenses were recorded in
connection with the acquisition of Coastal and other merger-related and restructuring activities.
During 2006, BB&T recorded merger-related and restructuring charges of $18 million, which are reflected in
BB&T’s Consolidated Statements of Income as a separate category of noninterest expenses. These amounts were
primarily associated with the write-off of duplicate software in connection with the Main Street acquisition and
systems conversion costs related to the acquisitions of Main Street and First Citizens.
During 2005, BB&T recorded net merger-related and restructuring credits, or gains of $11 million, which are
reflected in BB&T’s Consolidated Statements of Income as a separate category of noninterest expenses. These
amounts were primarily associated with the sale of duplicate facilities and the finalization of severance and other
personnel-related liabilities in connection with the First Virginia Banks, Inc. (“First Virginia”) and Republic
Bancshares, Inc. (“Republic”) acquisitions on terms more beneficial than originally estimated.
53