BB&T 2007 Annual Report Download - page 71
Download and view the complete annual report
Please find page 71 of the 2007 BB&T annual report below. You can navigate through the pages in the report by either clicking on the pages listed below, or by using the keyword search tool below to find specific information within the annual report.-
 1
1 -
2
-
3
-
4
-
5
-
6
-
7
-
8
-
9
-
10
-
11
-
12
-
13
-
14
-
15
-
16
-
17
-
18
-
19
-
20
-
21
-
22
-
23
-
24
-
25
-
26
-
27
-
28
-
29
-
30
-
31
-
32
-
33
-
34
-
35
-
36
-
37
-
38
-
39
-
40
-
41
-
42
-
43
-
44
-
45
-
46
-
47
-
48
-
49
-
50
-
51
-
52
-
53
-
54
-
55
-
56
-
57
-
58
-
59
-
60
-
 61
61 -
 62
62 -
 63
63 -
 64
64 -
 65
65 -
 66
66 -
 67
67 -
 68
68 -
 69
69 -
 70
70 -
 71
71 -
 72
72 -
 73
73 -
 74
74 -
 75
75 -
 76
76 -
 77
77 -
 78
78 -
 79
79 -
 80
80 -
 81
81 -
82
-
83
-
84
-
85
-
86
-
87
-
88
-
89
-
90
-
91
-
92
-
93
-
94
-
95
-
96
-
97
-
98
-
99
-
100
-
101
-
102
-
103
-
104
-
105
-
106
-
107
-
108
-
109
-
110
-
111
-
112
-
113
-
114
-
115
-
116
-
117
-
118
-
119
-
120
-
121
-
122
-
123
-
124
-
125
-
126
-
127
-
128
-
129
-
130
-
131
-
132
-
133
-
134
-
135
-
136
-
137
 |
 |

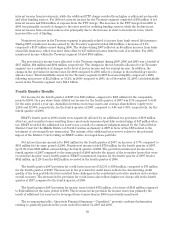
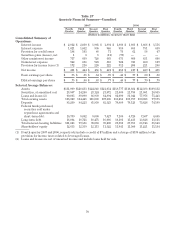
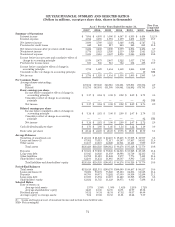
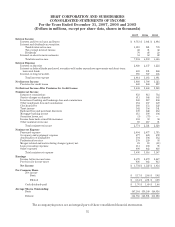
SIX YEAR FINANCIAL SUMMARY AND SELECTED RATIOS
(Dollars in millions, except per share data, shares in thousands)
As of / For the Years Ended December 31, Five Year
Compound
Growth Rate2007 2006 2005 2004 2003 2002
Summary of Operations
Interest income $ 7,894 $ 6,893 $ 5,506 $ 4,547 $ 4,355 $ 4,434 12.2 %
Interest expense 4,014 3,185 1,981 1,199 1,273 1,687 18.9
Net interest income 3,880 3,708 3,525 3,348 3,082 2,747 7.2
Provision for credit losses 448 240 217 249 248 263 11.2
Net interest income after provision credit losses 3,432 3,468 3,308 3,099 2,834 2,484 6.7
Noninterest income 2,774 2,521 2,326 2,119 1,828 1,541 12.5
Noninterest expense 3,636 3,516 3,167 2,896 3,045 2,234 10.2
Income before income taxes and cumulative effect of
change in accounting principle 2,570 2,473 2,467 2,322 1,617 1,791 7.5
Provision for income taxes 836 945 813 764 552 498 10.9
Income before cumulative effect of change in
accounting principle 1,734 1,528 1,654 1,558 1,065 1,293 6.0
Cumulative effect of change in accounting principle ————— 10NM
Net income $ 1,734 $ 1,528 $ 1,654 $ 1,558 $ 1,065 $ 1,303 5.9
Per Common Share
Average shares outstanding:
Basic 547,184 539,140 546,916 551,661 509,851 473,304 2.9
Diluted 551,755 543,891 551,380 556,041 514,082 478,793 2.9
Basic earnings per share
Income before cumulative effect of change in
accounting principle $ 3.17 $ 2.84 $ 3.02 $ 2.82 $ 2.09 $ 2.73 3.0
Cumulative effect of change in accounting
principle ————— .02NM
Net income $ 3.17 $ 2.84 $ 3.02 $ 2.82 $ 2.09 $ 2.75 2.9
Diluted earnings per share
Income before cumulative effect of change in
accounting principle $ 3.14 $ 2.81 $ 3.00 $ 2.80 $ 2.07 $ 2.70 3.1
Cumulative effect of change in accounting
principle ————— .02NM
Net income $ 3.14 $ 2.81 $ 3.00 $ 2.80 $ 2.07 $ 2.72 2.9
Cash dividends paid per share $ 1.76 $ 1.60 $ 1.46 $ 1.34 $ 1.22 $ 1.10 9.9
Book value per share $ 23.14 $ 21.69 $ 20.49 $ 19.76 $ 18.33 $ 15.70 8.1
Average Balances
Securities, at amortized cost $ 23,311 $ 21,348 $ 20,467 $ 18,218 $ 17,058 $ 16,939 6.6
Loans and leases (1) 87,952 79,313 71,517 66,107 57,857 50,851 11.6
Other assets 15,157 13,667 12,628 11,951 10,413 7,989 13.7
Total assets $126,420 $114,328 $104,612 $ 96,276 $ 85,328 $ 75,779 10.8
Deposits $ 83,501 $ 77,230 $ 70,346 $ 64,816 $ 56,948 $ 49,118 11.2
Long-term debt 18,045 14,628 11,959 10,886 11,710 12,135 8.3
Other liabilities 12,708 11,018 11,242 9,977 7,775 7,413 11.4
Shareholders' equity 12,166 11,452 11,065 10,597 8,895 7,113 11.3
Total liabilities and shareholders’ equity $126,420 $114,328 $104,612 $ 96,276 $ 85,328 $ 75,779 10.8
Period-End Balances
Total assets $132,618 $121,351 $109,170 $100,509 $ 90,467 $ 80,217 10.6
Loans and leases (1) 91,686 83,591 75,023 68,163 62,305 53,518 11.4
Deposits 86,766 80,971 74,282 67,699 59,350 51,280 11.1
Long-term debt 18,693 15,904 13,119 11,420 10,808 13,588 6.6
Shareholders’ equity 12,632 11,745 11,129 10,875 9,935 7,388 11.3
Selected Ratios
Rate of return on:
Average total assets 1.37% 1.34% 1.58% 1.62% 1.25% 1.72%
Average shareholders’ equity 14.25 13.35 14.95 14.71 11.97 18.32
Dividend payout 55.52 56.34 48.34 47.52 58.37 40.00
Average equity to average assets 9.62 10.02 10.58 11.01 10.42 9.39
(1) Loans and leases are net of unearned income and include loans held for sale.
NM= Not meaningful.
71