BB&T 2007 Annual Report Download - page 47
Download and view the complete annual report
Please find page 47 of the 2007 BB&T annual report below. You can navigate through the pages in the report by either clicking on the pages listed below, or by using the keyword search tool below to find specific information within the annual report.-
 1
1 -
2
-
3
-
4
-
5
-
6
-
7
-
8
-
9
-
10
-
11
-
12
-
13
-
14
-
15
-
16
-
17
-
18
-
19
-
20
-
21
-
22
-
23
-
24
-
25
-
26
-
27
-
28
-
29
-
30
-
31
-
32
-
33
-
34
-
35
-
36
-
 37
37 -
 38
38 -
 39
39 -
 40
40 -
 41
41 -
 42
42 -
 43
43 -
 44
44 -
 45
45 -
 46
46 -
 47
47 -
 48
48 -
 49
49 -
 50
50 -
 51
51 -
 52
52 -
 53
53 -
 54
54 -
 55
55 -
 56
56 -
 57
57 -
58
-
59
-
60
-
61
-
62
-
63
-
64
-
65
-
66
-
67
-
68
-
69
-
70
-
71
-
72
-
73
-
74
-
75
-
76
-
77
-
78
-
79
-
80
-
81
-
82
-
83
-
84
-
85
-
86
-
87
-
88
-
89
-
90
-
91
-
92
-
93
-
94
-
95
-
96
-
97
-
98
-
99
-
100
-
101
-
102
-
103
-
104
-
105
-
106
-
107
-
108
-
109
-
110
-
111
-
112
-
113
-
114
-
115
-
116
-
117
-
118
-
119
-
120
-
121
-
122
-
123
-
124
-
125
-
126
-
127
-
128
-
129
-
130
-
131
-
132
-
133
-
134
-
135
-
136
-
137
 |
 |

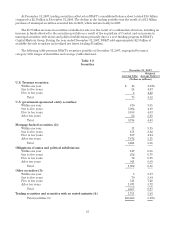
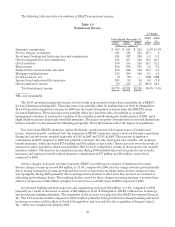
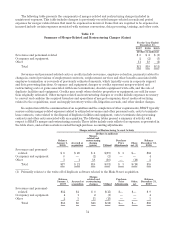
Table 15
FTE Net Interest Income and Rate / Volume Analysis
For the Years Ended December 31, 2007, 2006 and 2005
2007 vs. 2006 2006 vs. 2005
Average Balances Yield / Rate Income / Expense Increase
(Decrease)
Change due to Increase
(Decrease)
Change due to
2007 2006 2005 2007 2006 2005 2007 2006 2005 Rate Volume Rate Volume
(Dollars in millions)
Assets
Securities, at amortized cost (1):
U.S. Treasury securities $ 82 $ 113 $ 120 4.52% 3.56% 3.05% $ 4 $ 4 $ 4 $— $ 1 $ (1) $— $ — $—
U.S. government sponsored-entity securities (6) 10,373 11,616 12,299 4.58 4.02 3.78 475 467 465 8 61 (53) 2 29 (27)
Mortgage-backed securities 8,265 6,990 6,106 5.15 4.97 4.72 425 347 288 78 13 65 59 16 43
States and political subdivisions 873 607 699 6.65 6.89 6.73 58 42 47 16 (1) 17 (5) 1 (6)
Other securities 2,495 1,160 696 6.35 5.82 4.97 158 67 35 91 8 83 32 7 25
Trading securities 1,223 862 547 4.62 3.34 2.64 57 29 14 28 13 15 15 4 11
Total securities (5) 23,311 21,348 20,467 5.05 4.48 4.17 1,177 956 853 221 95 126 103 57 46
Other earning assets (2) 1,042 911 719 4.88 5.69 3.06 51 52 22 (1) (9) 8 30 22 8
Loans and leases, net of unearned income (1)(3)(4)(5) 87,952 79,313 71,517 7.67 7.53 6.59 6,749 5,973 4,713 776 114 662 1,260 714 546
Total earning assets 112,305 101,572 92,703 7.10 6.87 6.03 7,977 6,981 5,588 996 200 796 1,393 793 600
Non-earning assets 14,115 12,756 11,909
Total assets $126,420 $114,328 $104,612
Liabilities and Shareholders’ Equity
Interest-bearing deposits:
Interest-checking $ 2,297 $ 2,164 $ 1,797 2.31 1.87 0.80 53 40 14 13 10 3 26 23 3
Other client deposits 34,273 31,462 29,814 2.82 2.43 1.51 968 764 451 204 132 72 313 287 26
Client certificates of deposits 26,039 22,564 17,969 4.61 4.16 2.91 1,201 939 522 262 108 154 417 262 155
Other interest-bearing deposits 7,741 7,822 7,888 5.15 5.04 3.35 398 394 265 4 8 (4) 129 131 (2)
Total interest-bearing deposits 70,350 64,012 57,468 3.73 3.34 2.18 2,620 2,137 1,252 483 258 225 885 703 182
Federal funds purchased, securities sold under
repurchase agreements and short-term borrowed
funds(1) 9,325 7,006 7,386 4.55 4.30 3.04 424 301 224 123 18 105 77 90 (13)
Long-term debt 18,045 14,628 11,959 5.46 5.10 4.22 985 747 505 238 56 182 242 117 125
Total interest-bearing liabilities 97,720 85,646 76,813 4.12 3.72 2.58 4,029 3,185 1,981 844 332 512 1,204 910 294
Noninterest-bearing deposits 13,151 13,218 12,878
Other liabilities 3,383 4,012 3,856
Shareholders' equity 12,166 11,452 11,065
Total liabilities and shareholders’ equity $126,420 $114,328 $104,612
Average interest rate spread 2.98% 3.15% 3.45%
Net interest margin 3.52% 3.74% 3.89% $3,948 $3,796 $3,607 $152 $(132) $284 $189 $(117) $306
Taxable equivalent adjustment $68$88$83
(1) Yields are stated on a taxable equivalent basis assuming tax rates in effect for the periods presented.
(2) Includes Federal funds sold, securities purchased under resale agreements or similar arrangements, interest-bearing deposits with banks, and other earning assets.
(3) Loan fees, which are not material for any of the periods shown, have been included for rate calculation purposes.
(4) Nonaccrual loans have been included in the average balances. Only the interest collected on such loans has been included as income.
(5) Includes assets which were held for sale or available for sale at amortized cost and trading securities at fair value.
(6) Includes stock issued by the FHLB of Atlanta.
47